


- Bulls take a break with a small green candle #W1, whose body gaps above previous weeks candle.
Support & Resistance:
- The Daily 5 EMA, was support all week and the Monthly 5 EMA #M1, was resistance last week.
Moving Averages:
- The critical 5 EMA and 13 SMA, poised to cross or deflect on the Week Screen #W1.
Indicators:
- On the week charts the STS #W1, climbs above the over sold zone.
Wrap:
Looking Forward into this Week:
- 'Opening Black Marubozu' (Study Links here, here or elsewhere) is active on the Long Term chart #M1.
Support & Resistance:
- Bulls seek to clear the resistance at 8040, the 'Fibonacci 76.4% retrace of the 2010 low to the ATH)' #W1.
- The weekly 5 EMA, 7374 is the support that the bears would want to crack #W1.
Moving Averages:
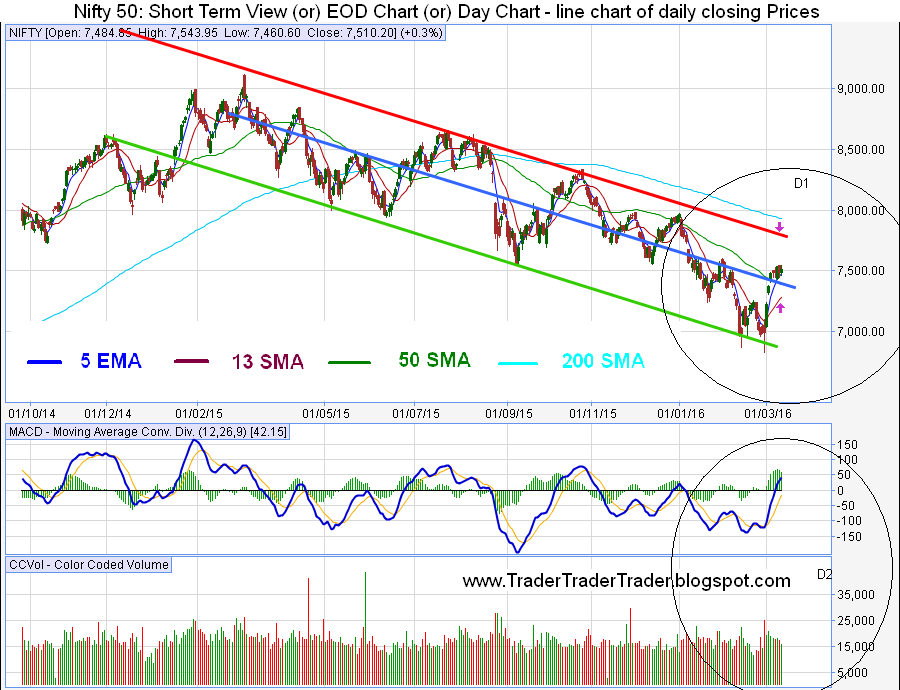
- The Death Cross (50 and 200 SMA) has been active for the past 6+ months #D1.
Indicators:
- The TRD staying above the 38.6% Fibo, for the month, helps the Bulls #M2.
Wrap :
Bulls hope the Pullback from the Weekly 200 SMA, to the Week Channel Bottom #W1, continues.
Bears Hope to persist below the Monthly 5 EMA 7578 #M1.