Monday, June 8, 2015

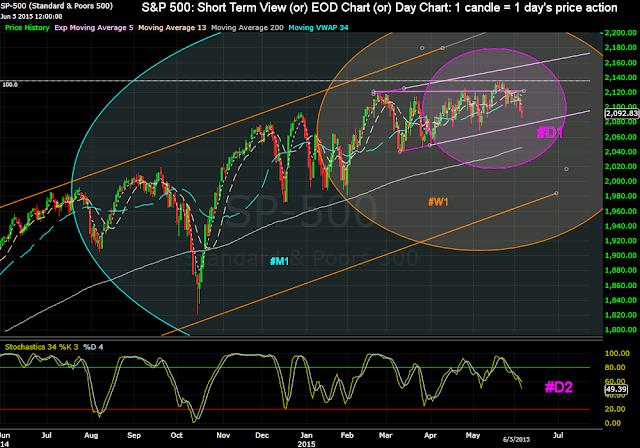
S&P 500 - Triple Screen 'Technical Analysis' - Counting Crows - Week 2 of June 2015.


Learning from last Week:  (click here for the previous post)


Patterns:
  • The last two candles on the Weekly Chart #W1, would form the first of three possible Crows #W1.
  • Index heads for the bottom of the Day Channel #D1 after two Spinning tops #M1.
Support & Resistance:
  • Index was resisted near the weekly 5 EMA #W1, while support was above the monthly 5 EMA  #M1.
Moving Averages:  
    • The all important, 5 EMA and 13 SMA, in the medium term view #W1, continues to stay deflected bullishly.
    Indicators:
    • RSI 13 is in the 50s #W2.

    Wrap:
    Bears manage two identical red weeks #W1, as they head towards the Day Channel's bottom #D1. Bulls hold the index well above our mark, the long term 5 EMA #M1.


    Looking forward into this Week:

    Patterns:
    • Possible Three Black Crows candle pattern on the medium term chart (Study Links herehere or elsewhere).
    • Bulls keep the index above the Long term 5 EMA, for the 4th month running. The previous two month candles #M1, are green and resemble spinning tops (Study Links herehere or elsewhere).
    Support & Resistance: 
    • 5 EMA on the Month Chart (2077) #M1, is the Index Support that Bears want to get below. 
    • Bulls seek to clear the ATH line #M1 with a clear break out from the Ascending Triangle #D1. 
    Moving Averages:
    • Bulls if they close this Week above 2088, will maintain the Bullish cross of the 5 EMA above the 13 SMA on the Weekly Charts  #W1.
    Indicators:
    • TSI, support at the 61.8% Fibonacci retrace, good for the Bulls #M2.


    Wrap:
    Bulls, keeping above the monthly 5 EMA #M1, look for a breakout and a resumption of the Bull run #D1.
    Bears after taking over the short term screen, look for a close below 2077 to stay in the red #M1.


    The Dow Jones - Ichimoku Study - Tenkan Sen Folds - Week 2 of June 2015.


    Introduction / Primer to Ichimoku can be read at this link (click). 


    Learning from the earlier Study: (click here for the post)

    Index falls below the Tenkan Sen Support #W2.
    Gap between the Tenkan Sen and Kijun Sen steady #W2.
    Senoku Span A & B, gap steady #W3.
    Chikou Span at the Price line #W1.

    Wrap: Index takes support at the Kijun Sen, Chikou span runs into the Price line #W1.


    Looking Forward into this Week:


    Bears eye the dwindling Thin Kumo #W2 (Study Links herehere or elsewhere) for an opportunity to dive into the Kumo.
    Cross of Tenkan Sen, to below the Kijun Sen, is next on Bear wishlist #W2.
    Chikou Span is now touching the Price line - set for a Bullish deflection or Bearish Cross at the Price line #W1.


    Wrap: Bulls look to stay above the Kijun Sen, Bears look for a Bearish Cross of the Chikou Span and the Price line #W2. 

    CNX Nifty 50 - Triple Screen 'Technical Analysis' - Channel Holds - Week 2 of June 2015.


    Learning from last Week: (click here for the previous post)


    Patterns:
    • Bullish Harami on the long term charts produces a red June candle as of now #M1.
    • Bearish Harami on the Weekly charts becomes a 'Three inside Down' #W1.
    Support & Resistance:
    • Index finds support at the Blue middle line of the EOW channel #W1, and near the 76.8% Fibonacci retrace as marked #W1. 
    • Blue middle line of the EOD channel #D1, resists the Index as does the 13 SMA on the weekly charts #W1.
    Moving Averages: 
    • The critical 5 EMA and 13 SMA on the Monthly charts, gets closer for a Bullish deflection or a Bearish cross off 7878 #W1.
    Indicators:
    • MACD and its MA stay below the zero line as does its Histogram #D2.


    Wrap:
    Bulls resisted at the 38.2% Fibo. of the move from the 'ATH to the May 2015 low' #D1, manages to close above the May 2015 low.
    Bears defend the blue middle line of the Day Channel and send the index towards its bottom #D1..


    Looking Forward into this Week:


    Patterns:
    • A Bullish Harami (Study Links herehere or elsewhere) #M1 is active on the long term chart. 'Three inside Down'  (Study Links herehere or elsewhere) #W1 is active on the medium term chart. 
    • The Fibonacci retrace from the ATH to the May 2015 bottom and its retrace possibilities are worth a study (Study Links herehere or elsewhere).
    Support & Resistance:
    • Bulls face resistance at the 61.8% Fibonacci retrace (8686) 'of the May 2015 low to the ATH' #D1.
    • Support is available, at the Day Channel's bottom line #D1 and the 76.4% Fibonacci retrace (8040) 'of the 2011 low to the ATH'  #W1 
    • Wall for June 2015 is 8321. 
    Moving Averages: 
    • Golden Cross (study herehere or elsewhere) of the 50 & 200 SMA is on - these MA's are currently converging #D1.
    • The 5 EMA and 13 SMA on the Medium Term charts would cross Bullishly with a weekly close above 8683 #W1.
    Indicators:
    • Bulls hope that the TRD would climb back above the 50% mark this month #M2.


    Wrap :
    Bulls look to get above the June Wall (8321) and close above 8683 #D1 .
    Bears seek to get to below the 76.8% Fibonacci retrace (8040) as marked and close below 7878 #W1. 


    BSE Sensex - Ichimoku Study - Kumo Attacked - Week 2 of June 2015.


    Introduction / Primer to Ichimoku can be read at this link (click). 


    Learning from the Earlier Study: (click here for the post)


    Bears attacks the Kumo, after Price deflected bearishly
    at the Chikou Span the previous week #W1.
    Gap between the Senkou Span A & B  narrows further #W3.
    Gap between the Tenkan Sen and the Kijun Sen is steady #W2.


    Wrap: 

    Bears holding on to a Bearish Tenkan Sen-Kijun Sen Cross & Chikou Span Cross, attack the Kumo #W1 &W2.
    Bulls are left with their last straw Senkou Span A & B cross  #W1.


    Looking Forward into this Week:


    Chikou Span can recross the Price line Bullishly, if the index bounces out of the Kumo #W1.

    Narrowing gap between the Senkou Span A & B, makes a bullish deflection or bearish cross, imminent #W3.
    Bull hope rests on getting back above the rather thick Kumo (Study Links herehere or elsewhere) #W2.


    Wrap:

    Bulls hope to repulse the attack on the rather thick Kumo, get the Chikou Span above the Price line and manage a deflection of the Senkou Span A & B  #W1. 
    Bears look to stay in the Kumo, retaining the Bearish Crosses #W2.