
.....Regulars can skip below and go straight to the chart......
Quick Reference :
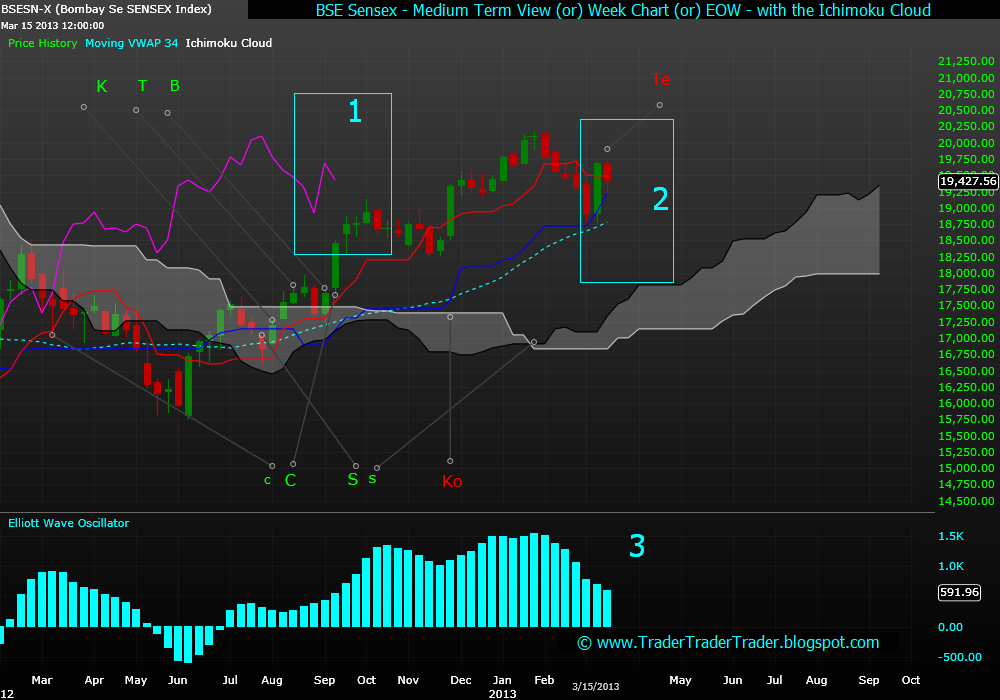
Chikou Span - pink line,
Kijun Sen - blue line,
Senkou Span A - black line,
Senkou Span B - grey line,
Kumo - grey shaded area,
Tenkan Sen - red line.
Previous Signals seen on BSE 30 - Week Chart (EOW) marked on chart as per notes below:
The Senoku Span Cross: Neutral Bullish Signal (Ss)
The Kijun Sen Cross: Neutral Bullish Signal (K)
The Tenkan Sen/Kijun Sen Cross: Strong Bullish Signal (T)
The Kumo Break-out: Bullish Signal (B)
The Chikou Span Cross: Strong Bullish Signal (Cc)
The Flat Kumo: Bearish Signal (Ko)
New:
The Tenkan Sen Cross: Bearish Signal (Te)
 |
| BSE 30 - End of Week Chart (EOW) - Analyzing 12 months Data - as on 15 March'13 |
Learning from the Past Week: (click here for the post)
Bulls use support at the Kijun Sen to prevent a crash #2.
Bears bring index below the Tenkan Sen again #2.
Bears bring index below the Tenkan Sen again #2.
Oscillator ticks down #3.
Chikou Span again heads towards the Price line #1.
Bulls and Bears even on the medium term Screen.
Looking Forward into the next Week:
Staying above the Kijun Sen - Bulls have some relief #2.
Bears see strength, below the Tenkan Sen #2.
Chikou Span meeting price line is good for Bears #1.
A Bearish / Bullish Cross of the Tenkan Sen and Kijun Sen, is the next action point to watch.