Monday, September 8, 2014

S&P 500 - Triple Screen 'Technical Analysis' - Starry Highs 2 - Week 2 of September 2014.


S&P 500: Long Term View (or) EOM Chart (or) Month Chart: 1 candle = 1 month's price action


S&P 500: Medium Term View (or) EOW Chart (or) Week Chart: 1 candle = 1 week's price action


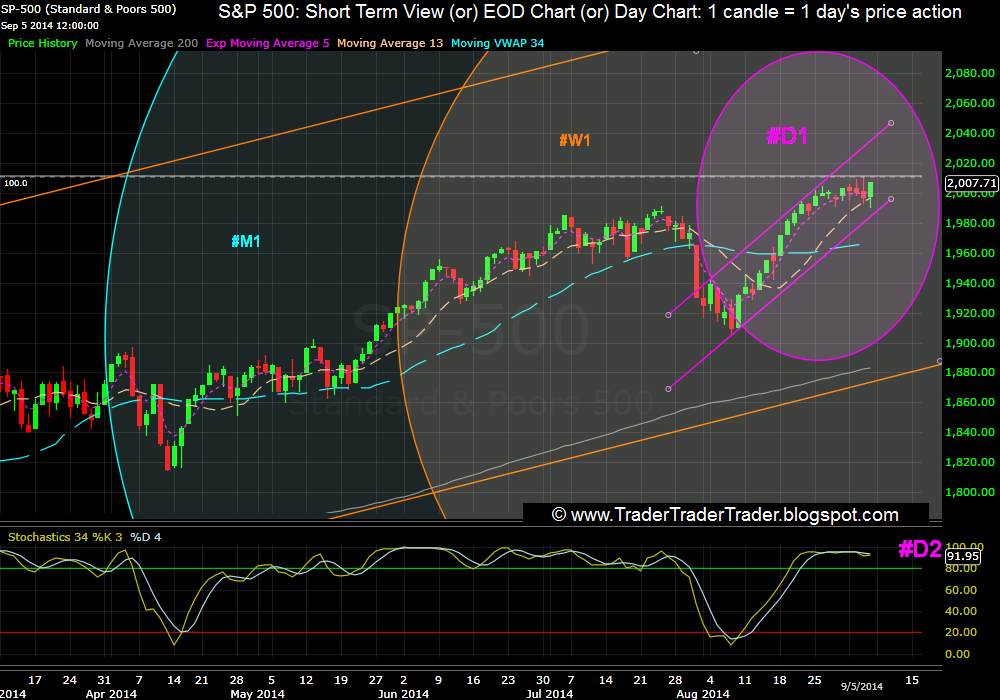
S&P 500: Short Term View (or) EOD Chart (or) Day Chart: 1 candle = 1 day's price action 


Learning from last Week:  (click here for the previous post)

Patterns:
  • Long Term Bullish Engulfing leans towards becoming a 3 outside up - see the last 3 Month candles #M1.
  • Evening Star possibility again apparent on the Weekly charts -  last week this same pattern failed to evolve #W1.
Support & Resistance:
  • Index rising along EOD channel's top line, neatly takes support at the channel bottom and as studied last week. the 13 SMA on the EOD #D1.
  • 5 EMA and 13 SMA, converge on the EOD #D1.
Moving Averages:  
    • Bulls close the week above all the MAs we track on all screens.
    Indicators:
    • RSI 13 meanders in the 60s #W2.
    • TSI continues holding, above its crucial Fibonacci level #M2.

    Wrap:
    Bears still control no screens, Index sticks to its new 2K+ levels .


    Looking forward into this Week:


    Patterns:

    • Possibility of another Evening Star formation (Study Links here, here or elsewhere)  on the EOW exists #W1.
    • Bullish Engulfing on long term charts can evolve into a 3 outside up (Study Links here, here or elsewhere) - to be watched for until month end #M1.
    Support & Resistance: 
    • EOD channel Top #D1 and the ATH, are resistances.
    • The 13 SMA on the EOD (e.g. 1998 for Monday) is the Support Bulls would want to defend #D1.
    Moving Averages:
    • Bullish deflection or Bearish cross of the 5 EMA and 13 SMA, imminent on the EOD #D1.
    Indicators:
    • TSI holding above the Fibonacci level 76.4%, works for the Bulls #M2.


    Wrap:
    Bulls seek to defend the 13 SMA on the EOD #D1.
    Bears look to continue to crack the EOD channel's bottom line #D1. 


    The Dow Jones - Ichimoku Study - Bulls Peak Again - Week 2 of September 2014.


    Dow 30 - End of  Week Chart (EOW) - Analyzing 24 Month's Data - as on 05 Sept'14


    Introduction / Primer to Ichimoku can be read at this link (click). 


    Learning from the earlier Study: (click here for the post)

    Bulls hold the Peak for the second time #W2.

    Gap between Tenkan Sen - Kijun Sen flat and narrow #W2.
    Gap between  Senoku Span A-B flat #W3.


    Wrap: Bulls hold the Peak again #W2.


    Looking Forward into this Week:


    Keeping above the Tenkan Sen - Bulls look for new Highs #W2.
    Bearish Cross or Bullish Deflection of Tenkan Sen & Kijun Sen, would continue to show direction going forward #W2.
    Previous Highs are a strong resistance #W1.


    Wrap: Bulls push for a breakout from these levels, Bears dig-in to defend the ATH zone, for the second time #W2.


    CNX Nifty 50 - Triple Screen 'Technical Analysis' - Bulls Star - Week 2 of September 2014.


    Nifty 50 - End of Month (EOM) Chart - Channel analyzing Data from 2008 onward - as on 05 Sept'14


    Nifty 50 - End of  Week (EOW) Chart - Channel analyzing Data from Mid 2011 onward - as on 05 Sept'14


    Nifty 50 - End of  Day  (EOD) Chart - Channel analyzing Data from Feb'2014, onward - as on 05 Sept'14


    Learning from last Week: (click here for the previous post)


    Patterns:
    • Bulls kill last week's Evening Star Possibility with another ATH #W1.
    • Earlier week's 'Above the Stomach' Pattern, keeps the Bulls going #W1.
    Support & Resistance:
    • Bulls keep above the 5 EMA on the EOD all week #D1. 
    • Bears fails to defend the EOD channel top - previous (steeper) channel active now #M1
    Moving Averages: 
    • The critical 5 EMA and 13 SMA on the EOD stay bullishly crossed to give Bulls continued dominance of all screens #D1.
    Indicators:
    • MACD and its MA are Bullishly Crossed - but MACD divergence to Price is huge #D2. 
    • STS stopped by its resistance line - but remains in the over bought #W1.

    Wrap:
    Bulls dominate all screen and make another new High, Bears fail to defend earlier EOD channel top line #D1.


    Looking Forward into this Week:


    Patterns:
    • Earlier week's 'Above the Stomach' Pattern (Study links here, here or elsewhere) near the Highs, warrant a careful look #W1.
    • Throwback (study) of Price to last week's EOD channel top #D1 - to be watched to assess Bull strength.
    Support & Resistance:
    • Support that the Bulls have to defend is the 5 EMA on the EOD ( 8068 for Monday) #D1.
    • Index  faces resistance at the new EOD channel top line #D1. 
    Moving Averages: 
    • Golden Cross (study here, here or elsewhere) of the 50 & 200 SMA is on - the MA's are currently steady #D1.
    Indicators:
    • STS slipping below the overbought, will work for the Bears #W1.


    Wrap:
    Bulls look to defend the the 5 EMA on the Day Chart and make new ATHs #D1.
    Bears seek to defend the current ATH ( 8142) #D1.


    BSE Sensex - Ichimoku Study - Bulls carry on - Week 2 of September 2014.


    BSE 30 - End of  Week Chart (EOW) - Analyzing 18 Month's Data - as on 05 Sept'14


    Introduction / Primer to Ichimoku can be read at this link (click). 


    Learning from the Earlier Study: (click here for the post)

    Bulls keep above the Tenkan Sen and make new ATH #W2.
    Senkou Span A & B - gap contracts #W3.
    Tenkan Sen and Kijun Sen gap even #W2


    Wrap: Bulls carry on, making new Highs while above the Tenkan Sen 
    #W2.


    Looking Forward into this Week:


    The Chikou Span, keeping current altitude, will need a couple of months to meet the price-line #W1.
    Bulls would seek to hold above the Tenkan Sen #W2.


    Wrap: Bears hope to get t
    he index below the Tenkan Sen, Bull focus is to keep above the Tenkan Sen to break the ATH #W2.


    Sunday, September 7, 2014

    The Wall on our Street


    Glossary -  Terms used in this Blog...

    Wall or Settlement Price:

    The Wall for any month, for the CNX Nifty, is the last half hour weighted average Price or approximately the EOD closing value of the last Thursday (THE settlement day) of the previous month.


    Example : 

    Wall for November 2014.

    The last Thursday AND settlement day for the previous month (i.e. October 2014) was 30th October 2014. 

    The EOD closing value for the Nifty on 30th October 2014, was 8169.

    Wall for November 2014,  is approximately 8171. 

    Likewise

    Wall for September 2015,  was approximately 7949.
    Wall for October 2015,  was approximately 7868. 

    Wall for November 2015,  was approximately 8112. 
    Wall for December 2015,  was approximately 7884. 
    Wall for January 2015,  was approximately 7946. 

    Wall for August 2016,  is approximately 8666. 

    Links below help us understand the relative importance of the 'Wall'. 


    Study links here, here or elsewhere.