

Saturday, January 25, 2014
Monday, January 20, 2014
S&P 500 - Triple Screen 'Technical Analysis' - Red 2014 - Week 4 of January 2014.
 |
| S&P 500 - End of Month Chart (EOM) - Channel analyzing Data from mid 2009, onward - as on 17 Jan'14 |
 |
| S&P 500 - End of Week Chart (EOW) - Channel analyzing Data from Aug'2011 onward - as on 17 Jan'14 |
 |
| S&P 500 - End of Day Chart (EOD) - Channel analyzing Data from Oct'2013, onward - as on 17 Jan'14 |
Learning from last Week: (click here for the previous post)
Patterns:
- Bullish '3 Inside up' #M1, on the Long Term Charts kept November and December candles green, with a new ATH.
- January 2014 candle remains red #M1.
- Index closes a mite below the 5 EMA on EOD, even as the MVWAP and Channel Bottom support the Bulls #D1.
- Bulls stay below the EOW channel top resistance (orange line) #W1.
- On the EOD the 5 EMA bearishly crosses below the 13 SMA and again mid-week, bullishly crosses above the 13 SMA #D1.
- RSI 13, stays in the overbought #W2.
- Month Chart Oscillator just below the overbought, as it has been after the August'13 Close #M2.
Wrap:
Bulls still see this year with a red hue, but retain strength - Bears continue to hold fort at the EOW channel top #D1, #W1..
Looking forward into this Week:
Patterns:
Support & Resistance:
- MVWAP 34 and EOD channel Bottom on the Short Term Chart continue to be Support for the Bulls.
- 'All Time High' Line and the Channel Top #W1 are resistances.
Moving Averages:
- Bears need to stay below the 5 EMA on the EOW to have a life #W1.
- Bulls need to keep the 5 EMA on the EOD above the 13 SMA to keep their life #D1.
- Stochastic 34 3 4 in the overbought zone, works for the Bulls #D1.
- Oscillator popping into the over-bought this month, can set the Bulls free #M1.
Wrap:
Bears seek momentum with a bearish cross of the 5 EMA &13 SMA on the EOD - Bulls want to get green back into 2014 candle (Month/Year).

The Dow Jones - Ichimoku Study - Tenkan Sen Visit - Week 4 of January 2014.
 |
| Dow 30 - End of Week Chart (EOW) - Analyzing 24 Month's Data - as on 17 Jan'14 |
Introduction / Primer to Ichimoku can be read at this link (click).
Learning from last Week: (click here for previous post)
Bulls get first green week of 2014 after a near bounce off the Tenkan Sen #W2.
Senoku Span A & B converge some more and head up #W3.
Gap between the Tenkan Sen and Kijun Sen widens #W2.
Wrap: Bulls keep stalemate on with a near bounce off the Tenkan sen #W2.
Looking Forward into this Week:
Convergence of Senoku Span A & B, a concern for Bulls #W3.
Gap between the Tenkan Sen and Kijun Sen wide, giving the Bulls some relief #W2.
Critical for Bulls to remain above current support (Tenkan Sen) #W2.
Wrap: Bulls look to keep momentum and make new ATHs while Bears pray the Tenkan Sen cracks #W2.
CNX Nifty 50 - Triple Screen 'Technical Analysis' - Wall holds again - Week 4 of January 2014.
 |
| Nifty 50 - End of Month (EOM) Chart - Channel analyzing Data from 2008 onward - as on 17 Jan'14 |
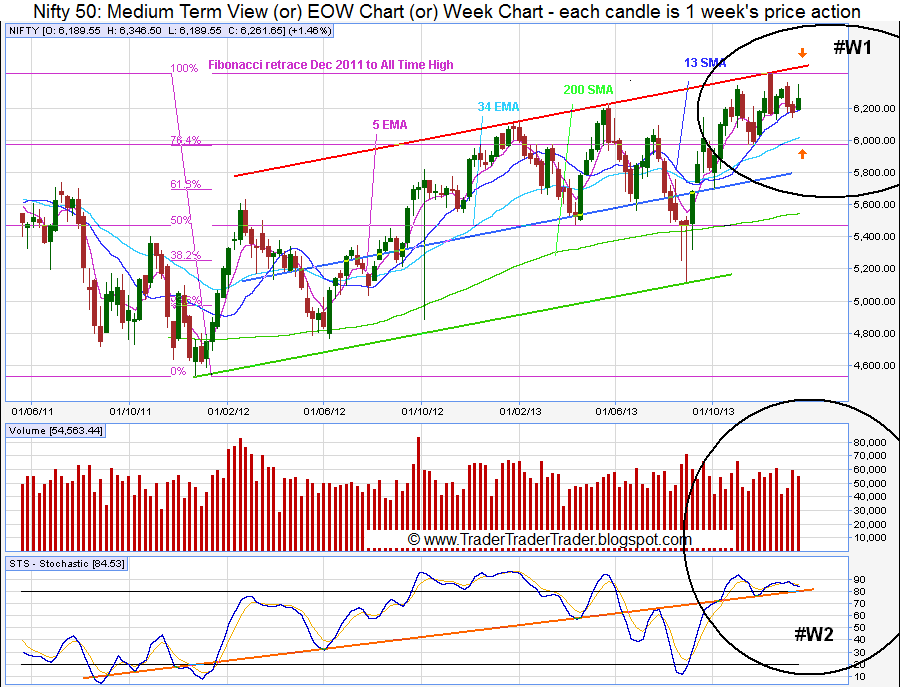 |
| Nifty 50 - End of Week (EOW) Chart - Channel analyzing Data from Mid 2011 onward - as on 17 Jan'14 |
 |
| Nifty 50 - End of Day (EOD) Chart - Channel analyzing Data from Aug'2013, onward - as on 17 Jan'14 |
Learning from last Week: (click here for the previous post)
Patterns:
- November and December candles will set up a Long Term 'Three Outside up' if January closes above December Close #M1.
- The EOW #W1 shows a Medium Term 'Three Outside Down' Candle Pattern followed by last week's green candle.
- Index breaks last week's resistance 13 SMA (EOD) to pull off a 250 odd point move but closes just below the Monthly 'Pivot Point' (Learn here, here or elsewhere) #D1.
- Bears held at Channel mid line Support on the EOD above most of the MAs we track, while Bulls were resisted last week near the previous ATH 6343.
- EOD - 50 SMA and 200 SMA continue converging for a Death Cross even as they currently stay crossed bullishly in a Golden Cross #D1.
- The medium term 5 EMA kept above the 13 SMA by the Bull up-move #W1.
- STS stays above resistance line #W2, a strong support for Bulls.
- MACD moves back into the plus zone with a negative divergence (arrow) #D2.
Wrap:
Bulls regain control of all screens - Bears continue to keep index below the Wall (6280) #W1.
Looking Forward into this Week:
Patterns:
- Bullish 'Three Outside up' (Study link here, here or elsewhere) on the Long Term Chart #M1 is possible - to be watched for.
- Bearish 'Three Outside down' (Study link here, here or elsewhere) on the Medium Term Chart, #W1 is active.
- 13 SMA Weekly (6195), is now support for the Index #W1.
- Earlier ATH i.e. 6343 is the current resistance holding back Bulls.
- Golden Cross (study here, here or elsewhere) 50 & 200 SMA - can even now give the Bulls verve to attempt new ATHs.
- Getting above the 5 EMA on the EOD is the immediate Bull task #D1.
- STS keeping above its support line, works for the Bulls #W2.
- Bulls need to cross and sustain above the Wall for the current series i.e. 6280 (Wall = Approx Hawala rate - study link here, here or elsewhere) to get back into the game.
Wrap:
Bulls seek to get above the Wall and target the ATH - Bears plan to stay below the Wall and break 6195.
BSE Sensex - Ichimoku Study - Tenkan Sen gives support - Week 4 of January 2014.
 |
| BSE 30 - End of Week Chart (EOW) - Analyzing 12 Month's Data - as on 17 Jan'14 |
Introduction / Primer to Ichimoku can be read at this link (click).
Learning from last Week: (click here for previous post)
Bulls retake the Tenkan Sen and make another dash at the ATH #W2.
Senkou Span A & B - gap rock steady #W3.
Distance between Tenkan Sen and Kijun Sen also steady #W2
Wrap: Bulls close above the Tenkan Sen to green 2014 #W2.
Looking Forward into this Week:
Chikou Span keeping above the Price Line critical for Bull moves #W1.
Bulls need to stay above the Tenkan Sen to remain in the game #W2.
Flattening of Tenkan Sen, Kijun Sen and the Senkou Span A & B indicative of consolidation before a major move #W2 #W3.
Wrap: Bears look get the Index below the Tenkan Sen #W2. Bulls eye the ATH.
Subscribe to:
Posts (Atom)