

Saturday, June 7, 2014
Monday, June 2, 2014
S&P 500 - Triple Screen 'Technical Analysis' - Marubozu on High - Week 1 of June 2014.
 |
| S&P 500 - End of Month Chart (EOM) - Channel analyzing Data from mid 2009, onward - as on 30 May'14 |
 |
| S&P 500 - End of Week Chart (EOW) - Channel analyzing Data from Aug'2011 onward - as on 30 May'14 |
 |
| S&P 500 - End of Day Chart (EOD) - Channel analyzing Data from Jan'14, onward - as on 30 May'14 |
Learning from last Week: (click here for the previous post)
Patterns:
- Bulls make a Marubozu #W1.
Support & Resistance:
- Index holds gains - the 5 EMA was support both on the Week Charts #W1 and Day charts #D1.
- New ATH made.
Moving Averages:
- The 5 EMA and 13 SMA #D1 deflection produces.gains for Bulls.
Indicators:
- RSI 13, stagnates in the 60s #W2.
- TSI continues holding above its crucial Fibonacci level #M2.
Wrap:
Bulls dominate all 3 screens - Bears get to defend a new ATH (All time High).
Looking forward into this Week:
Patterns:
Support & Resistance:
- 5 EMA on the EOW #W1 at a Index reading of 1895 is support for the week, while the Week Channel Top #W1 remains resistance.
Moving Averages:
- 5 EMA on the EOD #D1 - 1917 for Monday - would be the first line, Bears want to get below.
Indicators:
- Stochastic 34 3 4, staying back in the over-bought zone, works for the Bulls #D2.
Wrap:
Bulls like a continuation of life above the 5 EMA on the Day charts - Bear future lies a reversal of the index, to below the 13 SMA on the Weekly charts #W1.
The Dow Jones - Ichimoku Study - ATH Stop - Week 1 of June 2015.
 |
| Dow 30 - End of Week Chart (EOW) - Analyzing 24 Month's Data - as on 30 May'14 |
Introduction / Primer to Ichimoku can be read at this link (click).
Learning from the earlier Study: (click here for the post)
Bulls resisted at ATH #W2.
Price Line keeps well above the Tenkan Sen #W2.
At present height, the Chikou span seen running bearishly into the Price Line #W1.
Wrap: Index takes support at Tenkan Sen - new ATH holds again #W2.
Looking Forward into this Week:
Keeping above the Tenkan Sen - Bulls have hopes of a new ATH #W2.
Bearish Cross or Bullish Deflection of Tenkan Sen & Kijun Sen, would continue to show direction going forward #W2.
Bulls wary of the Chikou span bearishly crossing the Price line #W1.
Wrap: Bulls look to break and close above this range #W2, Bears hope to get below the Tenkan Sen #W2.
CNX Nifty 50 - Triple Screen 'Technical Analysis' - Engulfed - Week 1 of June 2014.
 |
| Nifty 50 - End of Month (EOM) Chart - Channel analyzing Data from 2008 onward - as on 30 May'14 |
 |
| Nifty 50 - End of Week (EOW) Chart - Channel analyzing Data from Mid 2011 onward - as on 30 May'14 |
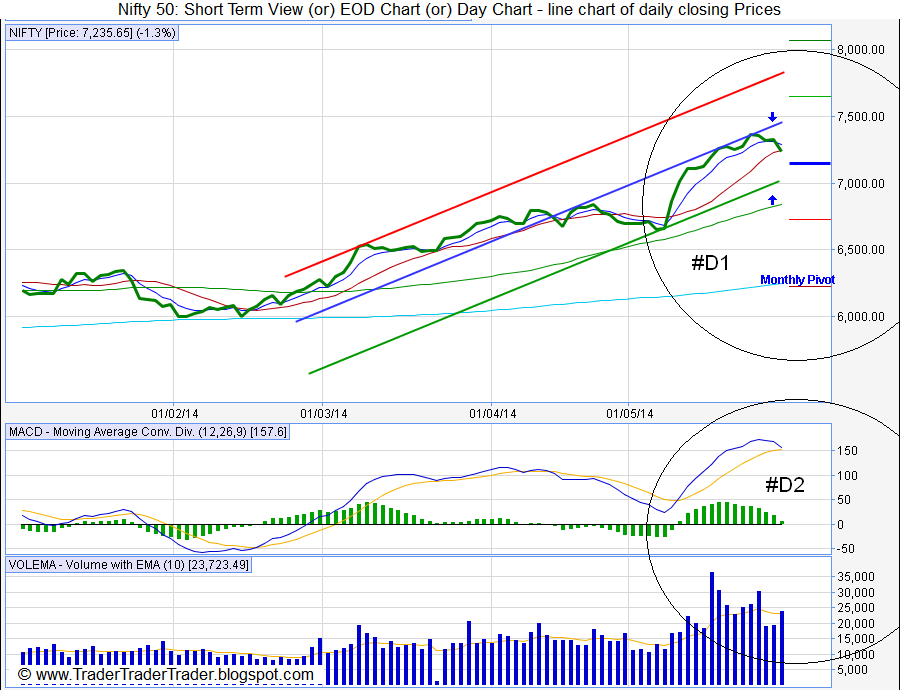 |
| Nifty 50 - End of Day (EOD) Chart - Channel analyzing Data from Feb'2014, onward - as on 30 May'14 |
Learning from last Week: (click here for the previous post)
Patterns:
- Bulls engulfed, but hold on to gains from the 'Medium Term', Three Outside up #W1.
- 13 SMA on the EOD #D1, was support for the Bulls even as they closed last week above our support of 7200.
- Day Channel Mid-line was resistance #D1.
Moving Averages:
- On EOD the 5 EMA and 13 SMA, is poised for Bearish Cross or Bullish Deflection #D1.
Indicators:
- STS crashes below its support line, but still in the overbought #W2.
- TRD above the 61.8% Fibonacci retrace #M2.
Wrap:
Bears Engulf Bulls #W1.
Looking Forward into this Week:
Patterns:
- Bulls look to the 'Medium Term', Three Outside up (Study links here, here or elsewhere) for some more gains.
- Bears push for the Bearish Engulfing (Study links here, here or elsewhere) to evolve into a Three outside Down (Study links here, here or elsewhere).
Support & Resistance:
- Support for Bulls is now the 5 EMA on the EOW i.e. 7117.
- 7236 (May Wall) is current resistance, that the Bears want to defend.
Moving Averages:
- Golden Cross (study here, here or elsewhere) of the 50 & 200 SMA is on and steady, even as index is clear above these SMAs #D1.
- Bearish Cross or Bullish Deflection of the 5 EMA and 13 SMA, up early next week #D1.
Indicators:
- TRD Indicator keeping above the 61.8% retrace is good for the Bulls #M2.
- STS staying below its support line, helps Bears #W2.
Wrap:
BSE Sensex - Ichimoku Study - Tenkan Sen Holds - Week 1 of June 2014.
 |
| BSE 30 - End of Week Chart (EOW) - Analyzing 24 Month's Data - as on 30 May'14 |
Introduction / Primer to Ichimoku can be read at this link (click).
Learning from the Earlier Study: (click here for the post)
Bulls keep just above Tenkan Sen and hold on to gains for the 15th straight week #W2.
Senkou Span A & B - gap increases #W3.
Tenkan Sen and Kijun Sen gap increase #W2
Wrap: Bulls fail to clear breakout ATH - but hold out above Tenkan Sen #W2.
Looking Forward into this Week:
Chikou Span, keeping current altitude, will meet the price-line, in a few months #W1.
Bears have the Tenkan Sen close to the Price line #W2.
Wrap: Bears hope is to get the index below the Tenkan sen, Bull focus is to hold recent Highs #W2.
Subscribe to:
Comments (Atom)