Learning from last Week: (click here for the previous post)
Patterns:
- Index, after triggering a long term Three Outside Down earlier - produces a Bullish Harami with the last two candles #M1.
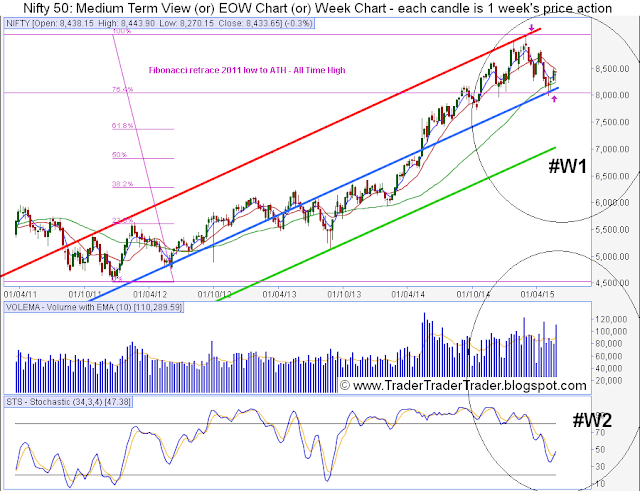
- Week Chart sees a Pinbar as part of a Bearish Harami - see last two candles #W1.
Support & Resistance:
- Index closes 10 points above the 38.2% Fibonacci retrace (8424) 'of the May 2015 low to the ATH' #D1 and at the daily 50 SMA #D1.
- Earlier in the week, the weekly 50 SMA #W1, was approached and the congestion area having the daily 5 EMA, 13 SMA and 200 SMA, overcome #D1.
Moving Averages:
- The critical 5 EMA and 13 SMA on the Monthly charts, gets closer for a Bullish deflection or a Bearish cross #W1.
Indicators:
- MACD and its MA stay below the zero line and its Histogram stays above this line #D2.
Wrap:
Bulls after a deep dive below the 38.2% of the move from the 'ATH to the May 2015 bottom' manage to close just above this line #D1.
Bears defend the daily 50 SMA #D1 and halt the index, near the blue middle line of the new Day Channel #D1..
Looking Forward into this Week:
Patterns:
- A Bullish Harami (Study Links here, here or elsewhere) #M1 is active on the long term chart. A Bearish Harami (Study Links here, here or elsewhere) #W1 is active on the medium term chart. Watch for the Three inside 'up or down' forming next.
- A Pinbar (Study Links here, here or elsewhere) #W1 is apparent on the weekly chart.
- The Fibonacci retrace from the ATH to the May 2015 bottom and its retrace possibilities are worth a study (Study Links here, here or elsewhere).
Support & Resistance:
- Bulls face resistance at the 61.8% Fibonacci retrace (8686) 'of the May 2015 low to the ATH' #D1 Support is available, at the Day Channel's bottom line #D1 and the 76.4% Fibonacci retrace (8040) 'of the 2011 low to the ATH' #W1
Moving Averages:
Indicators:
- Bulls hope that the TRD would rise from support at the 50% mark this month #M2.
Wrap :
Bulls look to stay above the 38.2% Fibonacci retrace (8424) 'of the May 2015 low to the ATH' and close above 8606 #D1 .
Bears, holding the Daily 50 SMA seek to get to below the 76.8% Fibonacci retrace (8040) as marked #W1.


