Monday, July 14, 2014

S&P 500 - Triple Screen 'Technical Analysis' - Bulls hold at Support - Week 3 of July 2014.


S&P 500: Long Term View (or) EOM Chart (or) Month Chart: 1 candle = 1 month's price action


S&P 500: Medium Term View (or) EOW Chart (or) Week Chart: 1 candle = 1 week's price action


S&P 500: Short Term View (or) EOD Chart (or) Day Chart: 1 candle = 1 day's price action


Learning from last Week:  (click here for the previous post)

Patterns:
  • Bears produce a Harami with a red week candle #W1.
  • Closing white (green in our screen) Marubozu of last week chooses reversal and not continuation #W1.
Support & Resistance:
  • ATH (All Time High) was resistance and the 5 EMA (weekly) was support #W1.
Moving Averages:  
  • The 5 EMA and 13 SMA, touch on the EOD #D1.
Indicators:
  • RSI 13 stays in the over bought #W2.
  • TSI continues holding above its crucial Fibonacci level #M2.

Wrap:
Bulls retain control of all Screens - Bears fail to close below the weekly 5 EMA  #W1.


Looking forward into this Week:


Patterns:
  • Harami (Bearish) on the Medium Term Screen is now active (Study links herehere or elsewhere).
Support & Resistance:
  • 5 EMA on the EOW #W1 at a Index reading of 1961 is support for the week, while the ATH  is resistance.
Moving Averages:
  • The 5 EMA and 13 SMA, poised to cross bearishly on the EOD #D1 - if the next Day candle Closes below 1967.
Indicators:
  • Stochastic 34 3 4, staying back in the over-bought zone, works for the Bulls #D2. 


Wrap:
Bulls seek to go above the last ATH i.e. 1986 - after a lucky 13 weeks above the weekly 5 EMA, Bears want to crack 1961 on the downside #W1. 


The Dow Jones - Ichimoku Study - Bulls Hold - Week 3 of July 2014.


Dow 30 - End of  Week Chart (EOW) - Analyzing 24 Month's Data - as on 11 July'14


Introduction / Primer to Ichimoku can be read at this link (click). 


Learning from the earlier Study: (click here for the post)

Bears push back index from ATH to Tenkan Sen #W2.

Gap between Tenkan Sen - Kijun Sen steady #W2.
Gap between  Senoku Span A-B steady #W3.


Wrap: Bears fail to get below Tenkan Sen again  #W2.


Looking Forward into this Week:


Keeping above the Tenkan Sen - Bulls look at new ATHs #W2.
Bearish Cross or Bullish Deflection of Tenkan Sen & Kijun Sen, would continue to show direction going forward #W2.
Bulls wary of the Chikou span bearishly crossing the Price line #W1.


Wrap: Bulls look to make new ATHs above the Tenkan Sen, Bears want life below the Tenkan Sen #W2.


CNX Nifty 50 - Triple Screen 'Technical Analysis' - Bears smell honey - Week 3 of July 2014.


Nifty 50 - End of Month (EOM) Chart - Channel analyzing Data from 2008 onward - as on 11 July'14


Nifty 50 - End of  Week (EOW) Chart - Channel analyzing Data from Mid 2011 onward - as on 11 July'14


Nifty 50 - End of  Day  (EOD) Chart - Channel analyzing Data from May'2014, onward - as on 11 July'14


Learning from last Week: (click here for the previous post)


Patterns:
  • Index falls dramatically to make an Engulfing Pattern #W1.
  • White (in our chart Green) Marubozo of last week, chooses reversal and not continuation #W1.
Support & Resistance:
  • Month Pivot's R1 was the exact resistance #D1 last week.  
  • Index passes through 5 EMA on the EOW #W1 and Wall for July (7494) to hold above the Daily 50 SMA #D1.
Moving Averages:
  • On EOD, the 5 EMA and 13 SMA, cross Bearishly #D1.  
Indicators:
  • STS Pull Back (study) stays below the resistance (earlier support) line, but is still in the overbought zone #W2. 
  • TRD remains shy, near the 76.4 % Fibonacci retrace #M2.


Wrap:
Bears take over the short term screen, while Bulls hold just above the 50 SMA on the Daily Chart #D1.


Looking Forward into this Week:


Patterns:
  • Engulfing Pattern on the Medium Term Screen is now active (Study links herehere or elsewhere).
  • Bearish Engulfing turning into a Three Outside Down (Study links herehere or elsewhere), is the next Bear Hope and Bull Nightmare #W1.
Support & Resistance:
  • Bears next want to reach & crack the 13 SMA on the EOW (7292) #W1.
  • The Bulls need to live life above the July Wall (7494, Wall = Approx Hawala rate - study link herehere or elsewhere) and defend the 50 SMA #D1.
Moving Averages: 
  • Golden Cross (study herehere or elsewhere) of the 50 & 200 SMA is on and steady, index is above these SMAs #D1.
Indicators:
  • TRD Indicator keeping below the 76.4% retrace is good for the Bears #M2.
  • STS getting above resistance (earlier support) line, helps Bull Cause #W2.


Wrap:
Bears look to break the 13 SMA on the EOW next #W1Bulls seek to get back above the July Wall and defend the 50 SMA #D1.


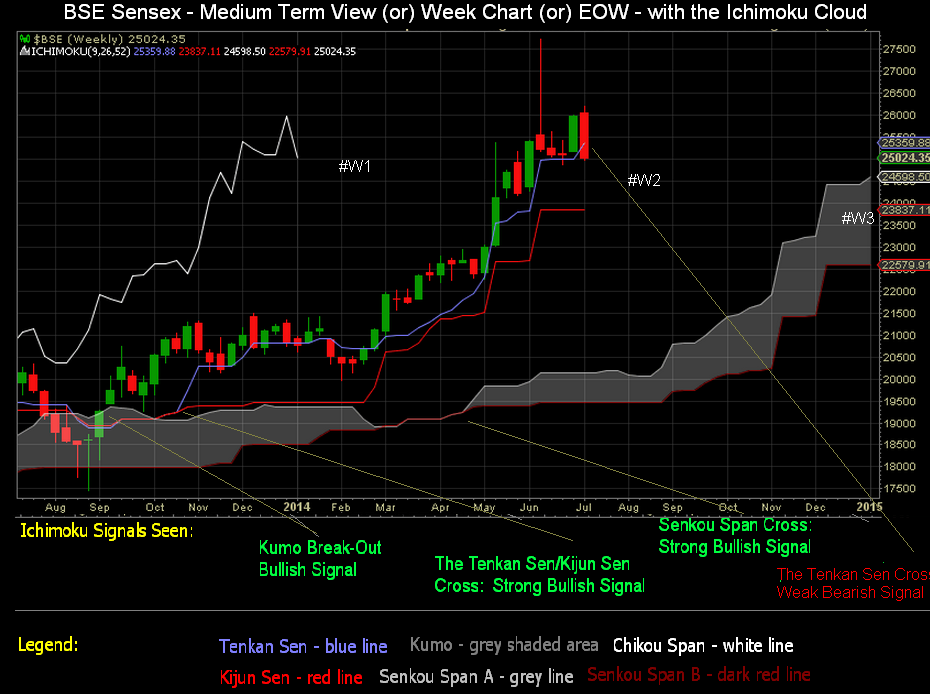
BSE Sensex - Ichimoku Study - Tenkan Sen Taken - Week 3 of July 2014.


BSE 30 - End of  Week Chart (EOW) - Analyzing 12 Month's Data - as on 11 July'14


Introduction / Primer to Ichimoku can be read at this link (click). 


Learning from the Earlier Study: (click here for the post)

Bears force a close below Tenkan Sen after 20 failed attempts #W2.
Senkou Span A & B - gap flares up #W3.
Tenkan Sen and Kijun Sen gap edges up #W2


Wrap: Bears succeed in closing index below Tenkan Sen, Bulls hold recent lows  
#W2.


Looking Forward into this Week:


The Chikou Span, keeping current altitude, will need a few months to meet the price-line #W1.
Bulls want to stay above recent lows and get back above the Tenkan Sen #W2. 


Wrap: Bears look to keep index below the 
Tenkan sen, Bull focus is to stay above recent lows and make it above the Tenkan Sen #W2.