Monday, May 2, 2016

US - S&P 500 - Triple Screen 'Technical Analysis' - High Wave - Week 1 of May 2016.


Learning from last Week:  (click here for the previous `post)


Patterns: 

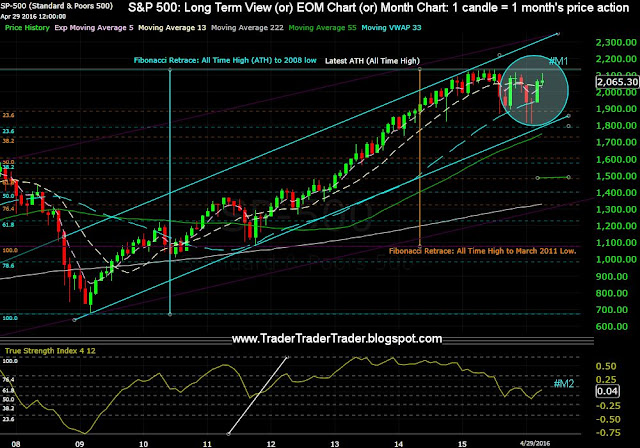
  • Bears keep the current high, lower than the previous (2116) #W1, taking the index below the Fork's bottom Tyne, April makes a High Wave candle #M1.
Support & Resistance:
  • Index keeps above the Monthly 5 EMA. Resistance near the last high (2116), helps the Bears get some red on the chart #D1.
Moving Averages:  
  • The critical 5 EMA, is below the 13 SMA, only on the Day Screen #D1.
Indicators:
  • STS slips from the over sold zone #D1.


Wrap:
Bears keep the index below the previous High #W1. Bulls continue to hold above the daily 222 SMA.


Looking forward into this Week:

Patterns:
  • Morning Star (Study Links herehere or elsewhere), is active on the Month Chart #M1. 
  • High Wave Candle (Study Links herehere or elsewhere) on the Month Chart, shows  some indecision among the players #M1. 
Support & Resistance: 
  • Last High (2116) continues to be the resistance to beat. The Daily 222 SMA, is still the support, that Bulls want to stay above #D1.
Moving Averages:
Indicators:
  • TSI is above the 50% mark #M2.


Wrap:
Tired Bulls, struggle to make a higher high (2116+) and a move to the ATH #W1.
Bears after the slip below the Fork, want to ensure a lower high (2116-) #D1.

India - CNX Nifty 50 - Triple Screen 'Technical Analysis' - Evening Doji Star Strikes - Week 1 of May 2016.


Learning from last Week: (click here for the previous post)

Patterns:
  • Last week's Weekly candle, was a red High Wave, it triggers the Evening Doji Star.pattern #W1.
Support & Resistance:
  • 13 SMA on the month screen #M1, was again resistance while the 5 EMA on the Week screen was support  #W1.
Moving Averages: 
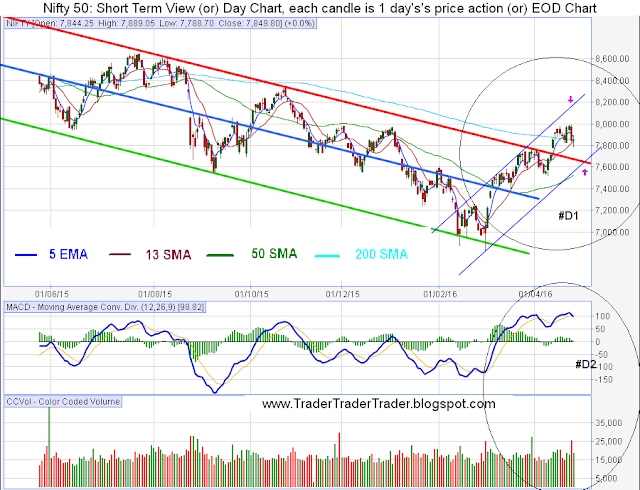
  • The critical 5 EMA, is now very close to the 13 SMA, on the Day screen #D1.
Indicators:
  • The TRD #M2, is facing resistance at the mid point (50% Fibonacci).

Wrap:
Pullback to Week Channel bottom almost done, Last week was advantage Bears #W1.


Looking Forward into this Week:

Patterns:
  • 'Evening Doji Star' (Study Links herehere or elsewhere) is active on the Medium Term chart #W1.
  • High Wave candle on the Week Chart, points to indecision (Study Links herehere or elsewhere)  #W1.
Support & Resistance:
  • Bulls would want to clear 8040, the 'Fibonacci 76.4% retrace of the 2010 low to the ATH)'  #W1. Bears would want to see the index get below the red Day Channel Top #D1.
Moving Averages: 
  • The Death Cross (50 and 200 SMA) has been active for the past 6+ months #D1.
Indicators:
  • The MACD is below its MA and its histogram ticking at the zero line, this is good news for Bears #D2.


Wrap :
Bulls need to get above 8040 #W1. Bears would want to continue the throw back to the red Day Channel top #D1.