Monday, September 8, 2014

S&P 500 - Triple Screen 'Technical Analysis' - Starry Highs 2 - Week 2 of September 2014.


S&P 500: Long Term View (or) EOM Chart (or) Month Chart: 1 candle = 1 month's price action


S&P 500: Medium Term View (or) EOW Chart (or) Week Chart: 1 candle = 1 week's price action


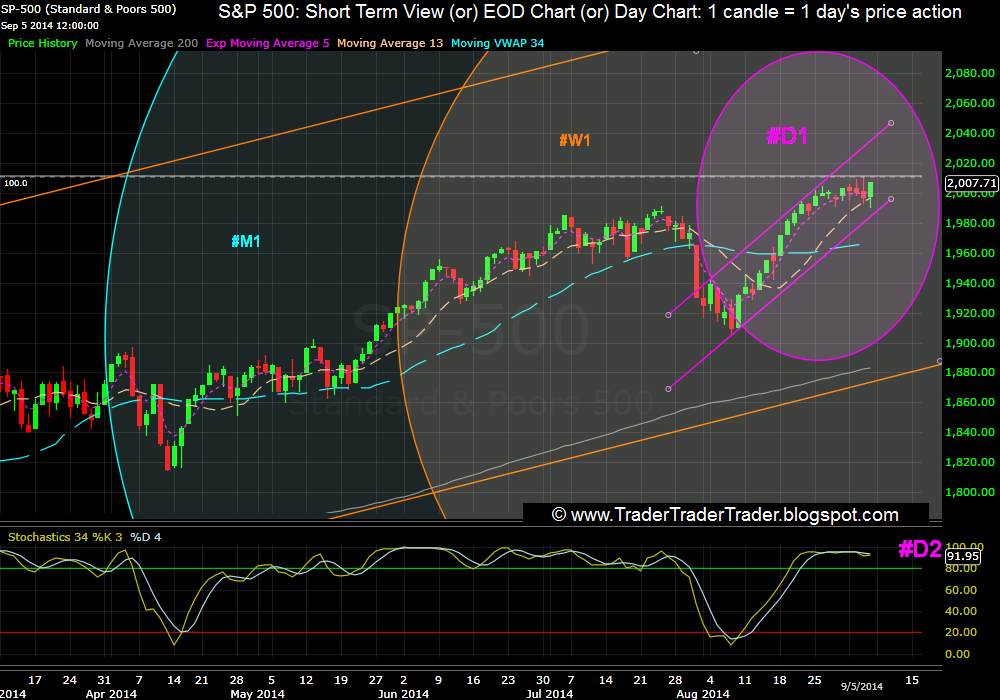
S&P 500: Short Term View (or) EOD Chart (or) Day Chart: 1 candle = 1 day's price action 


Learning from last Week:  (click here for the previous post)

Patterns:
  • Long Term Bullish Engulfing leans towards becoming a 3 outside up - see the last 3 Month candles #M1.
  • Evening Star possibility again apparent on the Weekly charts -  last week this same pattern failed to evolve #W1.
Support & Resistance:
  • Index rising along EOD channel's top line, neatly takes support at the channel bottom and as studied last week. the 13 SMA on the EOD #D1.
  • 5 EMA and 13 SMA, converge on the EOD #D1.
Moving Averages:  
    • Bulls close the week above all the MAs we track on all screens.
    Indicators:
    • RSI 13 meanders in the 60s #W2.
    • TSI continues holding, above its crucial Fibonacci level #M2.

    Wrap:
    Bears still control no screens, Index sticks to its new 2K+ levels .


    Looking forward into this Week:


    Patterns:

    • Possibility of another Evening Star formation (Study Links herehere or elsewhere)  on the EOW exists #W1.
    • Bullish Engulfing on long term charts can evolve into a 3 outside up (Study Links herehere or elsewhere) - to be watched for until month end #M1.
    Support & Resistance: 
    • EOD channel Top #D1 and the ATH, are resistances.
    • The 13 SMA on the EOD (e.g. 1998 for Monday) is the Support Bulls would want to defend #D1.
    Moving Averages:
    • Bullish deflection or Bearish cross of the 5 EMA and 13 SMA, imminent on the EOD #D1.
    Indicators:
    • TSI holding above the Fibonacci level 76.4%, works for the Bulls #M2.


    Wrap:
    Bulls seek to defend the 13 SMA on the EOD #D1.
    Bears look to continue to crack the EOD channel's bottom line #D1. 


    The Dow Jones - Ichimoku Study - Bulls Peak Again - Week 2 of September 2014.


    Dow 30 - End of  Week Chart (EOW) - Analyzing 24 Month's Data - as on 05 Sept'14


    Introduction / Primer to Ichimoku can be read at this link (click). 


    Learning from the earlier Study: (click here for the post)

    Bulls hold the Peak for the second time #W2.

    Gap between Tenkan Sen - Kijun Sen flat and narrow #W2.
    Gap between  Senoku Span A-B flat #W3.


    Wrap: Bulls hold the Peak again #W2.


    Looking Forward into this Week:


    Keeping above the Tenkan Sen - Bulls look for new Highs #W2.
    Bearish Cross or Bullish Deflection of Tenkan Sen & Kijun Sen, would continue to show direction going forward #W2.
    Previous Highs are a strong resistance #W1.


    Wrap: Bulls push for a breakout from these levels, Bears dig-in to defend the ATH zone, for the second time #W2.


    CNX Nifty 50 - Triple Screen 'Technical Analysis' - Bulls Star - Week 2 of September 2014.


    Nifty 50 - End of Month (EOM) Chart - Channel analyzing Data from 2008 onward - as on 05 Sept'14


    Nifty 50 - End of  Week (EOW) Chart - Channel analyzing Data from Mid 2011 onward - as on 05 Sept'14


    Nifty 50 - End of  Day  (EOD) Chart - Channel analyzing Data from Feb'2014, onward - as on 05 Sept'14


    Learning from last Week: (click here for the previous post)


    Patterns:
    • Bulls kill last week's Evening Star Possibility with another ATH #W1.
    • Earlier week's 'Above the Stomach' Pattern, keeps the Bulls going #W1.
    Support & Resistance:
    • Bulls keep above the 5 EMA on the EOD all week #D1
    • Bears fails to defend the EOD channel top - previous (steeper) channel active now #M1
    Moving Averages: 
    • The critical 5 EMA and 13 SMA on the EOD stay bullishly crossed to give Bulls continued dominance of all screens #D1.
    Indicators:
    • MACD and its MA are Bullishly Crossed - but MACD divergence to Price is huge #D2. 
    • STS stopped by its resistance line - but remains in the over bought #W1.

    Wrap:
    Bulls dominate all screen and make another new High, Bears fail to defend earlier EOD channel top line #D1.


    Looking Forward into this Week:


    Patterns:
    • Earlier week's 'Above the Stomach' Pattern (Study links herehere or elsewherenear the Highs, warrant a careful look #W1.
    • Throwback (study) of Price to last week's EOD channel top #D1 - to be watched to assess Bull strength.
    Support & Resistance:
    • Support that the Bulls have to defend is the 5 EMA on the EOD ( 8068 for Monday) #D1.
    • Index  faces resistance at the new EOD channel top line #D1. 
    Moving Averages: 
    • Golden Cross (study herehere or elsewhere) of the 50 & 200 SMA is on - the MA's are currently steady #D1.
    Indicators:
    • STS slipping below the overbought, will work for the Bears #W1.


    Wrap:
    Bulls look to defend the the 5 EMA on the Day Chart and make new ATHs #D1.
    Bears seek to defend the current ATH ( 8142) #D1.


    BSE Sensex - Ichimoku Study - Bulls carry on - Week 2 of September 2014.


    BSE 30 - End of  Week Chart (EOW) - Analyzing 18 Month's Data - as on 05 Sept'14


    Introduction / Primer to Ichimoku can be read at this link (click). 


    Learning from the Earlier Study: (click here for the post)

    Bulls keep above the Tenkan Sen and make new ATH #W2.
    Senkou Span A & B - gap contracts #W3.
    Tenkan Sen and Kijun Sen gap even #W2


    Wrap: Bulls carry on, making new Highs while above the Tenkan Sen 
    #W2.


    Looking Forward into this Week:


    The Chikou Span, keeping current altitude, will need a couple of months to meet the price-line #W1.
    Bulls would seek to hold above the Tenkan Sen #W2.


    Wrap: Bears hope to get t
    he index below the Tenkan Sen, Bull focus is to keep above the Tenkan Sen to break the ATH #W2.