Monday, March 27, 2017

S&P 500 (Americas, USA) - 'Weekly Technical Analysis' - Bearing Lower - Week 5 of March 2017.


Zoom into chart .. Click 


Learning from last Week:  (click here for the previous post)

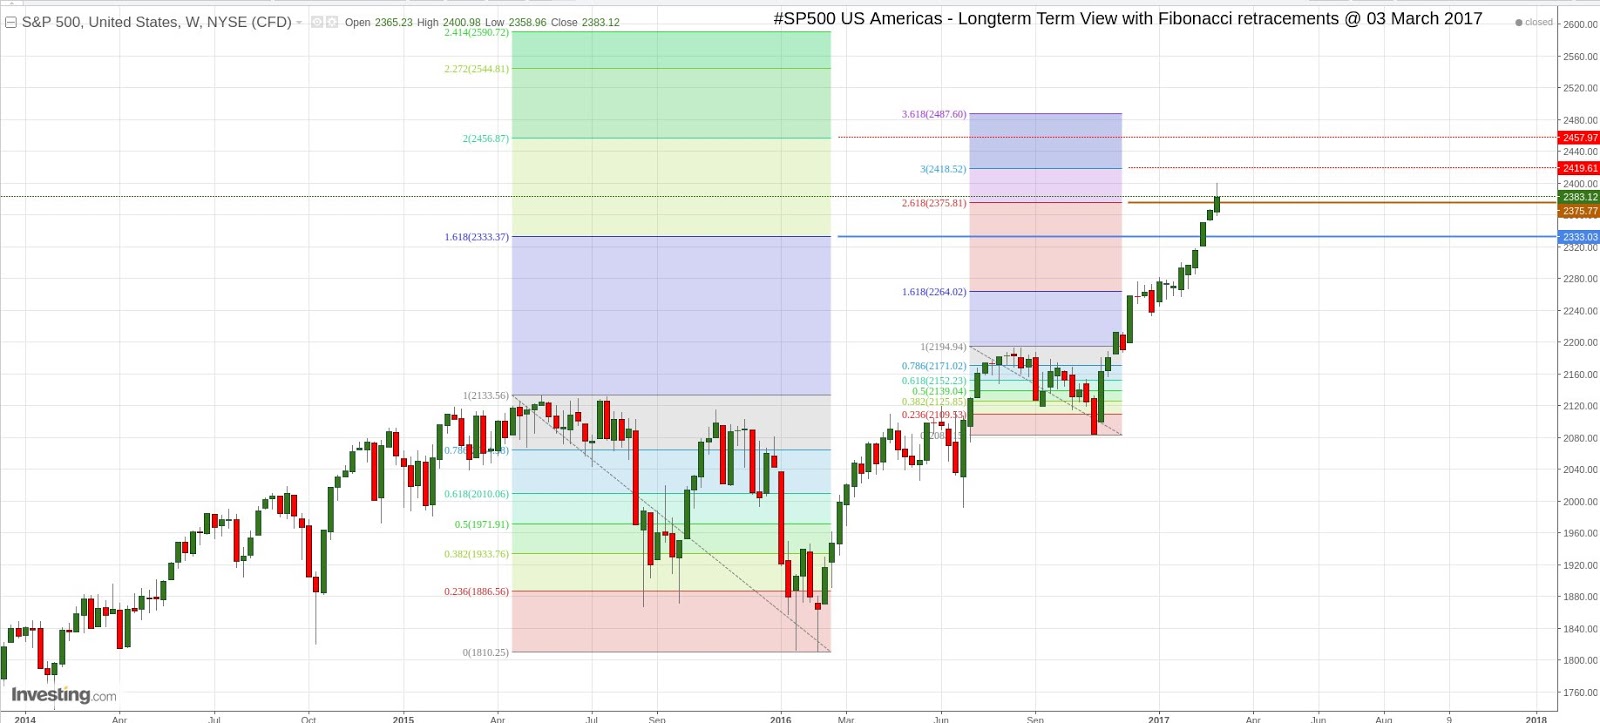
Index slips lower below the 1.62 Fibonacci resistance of a major retrace as seen above.
Bear camp attempts to hold this line early this week.

Wrap: 

The Index falls below the 2.62 extension of the last minor High-Low and is now at the 1.62 extension of the  last major High-Low.


Looking forward into this Week:

Bears hope to close the week below the current resistance (1.62).

Bulls seek Higher Highs and a close above this major level (1.62).
Index Support and Resistance possibilities are marked as above. 


Wrap:
Bulls seeking another major Break out - run down below major resistances.
Bears having taken advantage of the earlier (2.62) resistance, seek to keep the pressure on and change the trend


CAC 40 (Europe Paris) - Ichimoku Weekly Study - Stall? - Week 5 of March 2017.


Zoom into chart .. Click 


Introduction / Primer to Ichimoku can be read at this link (click).


Learning from the Earlier Study: (click here for the previous post)

Index makes another High Wave candle, looks like its stalling in the same space.

Index is at a Higher High and above all indicators.
Chikou Span (White) goes flat (extreme left).

Wrap:
Index stalls and makes another indecisive High Wave candle.


Looking Forward into this Week:


Bears want to see some red and the Chikou Span headed back towards the Kumo (extreme left).
Bulls maintain Higher High - Higher Low but seem to have run out of spirit.

Bears now look to bring the index below the supports marked.

Wrap:


Bulls need to push above recent highs to maintain Index triggers as Bullish.
Hopeful Bears hope to see the index below the Tenkan Sen (Center).


SGX Nifty (Asia Singapore) - Ichimoku Weekly Study - Inside week @ Resistance - Week 5 of March 2017.


Zoom into chart .. Click 


Introduction / Primer to Ichimoku can be read at this link (
click).


Learning from the Earlier Study: (click here for the previous post)

Index goes read at the March 2015 High.

Chikou Span (white) dips in tandem, way above the price line (see extreme left). 
Price some distance above the Tenkan Sen (blue).

Wrap:
Bears force two weekly closes below the marked Resistance, despite the Bullish Tenkan Sen-Kijun Sen Cross.


Looking Forward into this Week:


Bulls hold on to a Tenkan Sen and Kijun Sen cross - which is a strong Bullish Signal.
Chikou Span - needs to stay above the Price line to keep the Bull move alive.
Bears dream of defending the March 2015 High, and crashing the index to sub 7070 levels.


Wrap: 
Bears would want to continue defending the current resistance and get the Index back below Weekly Supports. 

Bulls aim for Higher highs on the back of the Bullish 'Tenkan Sen- Kijun Sen Cross'. 


Saturday, March 25, 2017

Brent Crude Oil - Ichimoku Weekly Study - Kijun Sen Close - Week 5 of March 2017.


Zoom into chart .. Click


Introduction / Primer to Ichimoku can be read at this link (click).


Learning from the Earlier Study: (click here for the previous post)


After the indecisive High Wave candle of the previous week - Index takes a dive, but closes the week exactly at marked support - the Kijun Sen (red).
Index stays between the 61.8% and 50% Fibonacci retrace of the last major High & Low.
Chikou Span (white) hovers just above the price line (see extreme left).

Wrap:   

Chikou Span close to Price line, Index stoic, closes above the Kijun Sen. 


Looking Forward into this Week:

Bulls would want to get Index above the Tenkan Sen(blue) and prevent the Chikou Span from going  below the Price line.
Bears want to see Index retest the bottom and to start with, aim for the Kumo (cloud).
With three weeks of Support @ Kijun Sen, Bulls look to get back lost ground.

Wrap: 

Stoic Bulls seek to use the Kijun Sen support to get back above the 61.8% Fibonacci retrace
Bears pushing lower each week, want to see the Index close below the marked supports to reach the Kumo.


Say..


Tuesday, March 21, 2017

S&P 500 (Americas, USA) - 'Weekly Technical Analysis' - High Wave (in)Decisions - Week 4 of March 2017.


Zoom into chart .. Click 


Learning from last Week:  (click here for the previous post)

Index again fluctuates about the 2.62 Fibonacci resistance - making a High Wave candle.
Bears force a range last week.


Wrap: 

The Index again faces resistance at the 2.62 extension of the last minor High-Low.


Looking forward into this Week:

Bears hope to Hold the index below the current resistance.

Bulls seek Higher Highs and Support at current levels.
Index Support and Resistance possibilities are marked as above. 


Wrap:
Bulls seeking another major Break out - run into a spot of resistance.
Bears need to take advantage of this lull, failing which Index looks to continue trend


Monday, March 20, 2017

CAC 40 (Europe Paris) - Ichimoku Weekly Study - Next High? - Week 4 of March 2017.


Zoom into chart .. Click 


Introduction / Primer to Ichimoku can be read at this link (click).


Learning from the Earlier Study: (click here for the previous post)

Index edges higher after a High Wave candle the previous week.

Index is at a Higher High and above all indicators.
Chikou Span (White) moves up (extreme left).

Wrap:
Index edges higher after an indecisive High Wave candle.


Looking Forward into this Week:


Bears want to see some red and the Chikou Span headed back towards the Kumo (extreme left).
Bulls on a roll after a range break and maintain Higher High - Higher Low
.
Bears now need to bring the index below the supports marked.

Wrap:


Dominant Bulls expect more green as Index triggers are Bullish.
Desperate Bears hope to see the index retest (a climbing) Tenkan Sen (Center).


SGX Nifty (Asia Singapore) - Ichimoku Weekly Study - Higher High? - Week 4 of March 2017.


Zoom into chart .. Click 


Introduction / Primer to Ichimoku can be read at this link (
click).


Learning from the Earlier Study: (click here for the previous post)

Index pops above the March 2015 High, but closes below it, for the week.

Chikou Span (white) spikes (see extreme left). 
Tenkan Sen (blue) and Kijun Sen (red) in a Bullish Cross.

Wrap:
Index makes a Higher High and mulls life above it - with a Strong Bullish Cross to back it.


Looking Forward into this Week:


Bulls hold on to a Tenkan Sen and Kijun Sen cross - which is a strong Bullish Signal.
Chikou Span - needs to stay above the Price line to keep the Bull move alive.
Bears dream of defending the March 2015 High, and crashing the index to sub 7070 levels.


Wrap: 
Desperate Bears would want to defend the current resistance and get Index back below Weekly Supports. 

Dominant Bulls plan for Higher highs on the back of the Bullish 'Tenkan Sen- Kijun Sen Cross'. 


Saturday, March 18, 2017

Brent Crude Oil - Ichimoku Weekly Study - Kijun Sen Stops - Week 4 of March 2017.


Zoom into chart .. Click


Introduction / Primer to Ichimoku can be read at this link (click).


Learning from the Earlier Study: (click here for the previous post)


Index makes a High Wave candle, last week - Closes above marked support - the Kijun Sen (red).
Index stays between the 61.8% and 50% Fibonacci retrace of the last major High & Low.
Chikou Span (white) hovers above the price line (see extreme left).

Wrap:   

Chikou Span steadies, Index undecided, closes above the Kijun Sen. 


Looking Forward into this Week:

Bulls would want to get above the Tenkan Sen(blue) before the Chikou Span hits the Price line.
Bears want to see Index retest the bottom and to start with, aim for the Kumo (cloud).
With the Support @ Kijun Sen, Bulls look to get back lost ground.

Wrap: 

Bulls seek to use the current support to get back above the 61.8% Fibonacci retrace
Bears want to see the Index close below the marked supports and reach the Kumo.


Say..


Monday, March 13, 2017

S&P 500 (Americas US) - 'Weekly Technical Analysis' - Some Red - Week 3 of March 2017.


Zoom into chart .. Click 


Learning from last Week:  (click here for the previous post)

Index runs into resistance at the 2.62 Fibonacci resistance shown above.
Desperate Bears score their first red candle in weeks.
Last week's candle makes a Bearish Harami (google 'Bearish Harami') with the previous Green Candle.

Wrap: 

The Index faces resistance at the 2.62 extension of the last minor High-Low.


Looking forward into this Week:

Bears hope to Hold the index below the current resistance.

Bulls seek Higher Highs and Support at current levels.
Index Support and Resistance possibilities are marked as above. 


Wrap:
Bulls seeking another major Break out - run into a spot of resistance.
Desperate Bears look for a 'Three inside Down' as a follow up to the Harami. 


CAC 40 (Europe Paris) - Ichimoku Weekly Study - High Wave - Week 3 of March 2017.


Zoom into chart .. Click 


Introduction / Primer to Ichimoku can be read at this link (click).


Learning from the Earlier Study: (click here for the previous post)

Index makes a High Wave candle after the spike last week.

Index is at a Higher High and above all indicators.
Chikou Span (White) flattens (extreme left).

Wrap:
Index  after the take off towards the April 2015 High, makes a indecisive High Wave candle last week.


Looking Forward into this Week:


Bears want to see the Chikou Span headed back towards the Kumo (extreme left).
Bulls get a range break and maintain Higher High - Higher Low
.
Bears now need to bring the index below the supports marked.

Wrap:


Index post breakout mode, shows need to consolidate with a High Wave candle.
Bears hope to see the index retest (a climbing) Tenkan Sen (Center).


SGX Nifty (Asia Singapore) - Ichimoku Weekly Study - Knocking @ High - Week 3 of March 2017.


Zoom into chart .. Click 


Introduction / Primer to Ichimoku can be read at this link (
click).


Learning from the Earlier Study: (click here for the previous post)

Index closes at the September 2016 High last week and heads for the March 2015 High now.

Chikou Span (white) deflects above the Price line after a touch of the September 2016 high (see extreme left). 
Tenkan Sen (blue) and Kijun Sen (red) in a Bullish Cross.

Wrap:
Index takes off from support and is negotiating another previous High - with a Strong Bullish Cross to back it.


Looking Forward into this Week:


Bulls get a Tenkan Sen and Kijun Sen cross - which is a strong Bullish Signal.
Chikou Span - needs to stay above the Price line to keep the Bull move alive.
Bears dream of defending the March 2015 High, and crashing the index to sub 7070 levels.


Wrap: 
Bears would want to defend the current resistance and get Index back below Weekly Supports. 

Bulls plan for Higher highs on the back of the Bullish 'Tenkan Sen- Kijun Sen Cross'. 


Saturday, March 11, 2017

Brent Crude Oil - Ichimoku Weekly Study - Kijun Sen Stop - Week 3 of March 2017.


Zoom into chart .. Click


Introduction / Primer to Ichimoku can be read at this link (click).


Learning from the Earlier Study: (click here for the previous post)


Index breaks range - Stops exactly at marked support - the Kijun Sen (red).
Index is now between the 61.8% and 50% Fibonacci retrace of the last major High & Low.
Chikou Span (white) also dives - towards the price line (see extreme left).

Wrap:   

Chikou Span dives, Index is dives. Last week's candle stops exactly at the Kijun Sen. 


Looking Forward into this Week:

Bulls would want to get above the Tenkan Sen(blue) before the Chikou Span hits the Price line.
Bears want to see Index retest the bottom and to start with look to get to the Kumo (cloud).
With the range break to Support, Bulls look to get back lost ground.

Wrap: 

Bulls look to use the current support to get back above the 61.8% Fibonacci retrace
Bears want to see the Index get below the marked supports and hit the Kumo.


Say..


Monday, March 6, 2017

S&P 500 (Americas US) - 'Weekly Technical Analysis' - Long Term Channel Breakout? - Week 2 of March 2017.


Learning from last Week:  (click here for the previous post)


Patterns:
Index again closes week above the Monthly Fork's top Tyne #Monthlychart.

Support & Resistance:
The Index support and resistance options are shown in the first chart above.

Moving Averages:
The critical EMA 5, is bullishly above the MA 13, on all Screens. 

Indicators:
The revised TSI is at the 76.8% Fibo Retrace #MonthlyChart. 


Wrap: 

The Index trades above the 1.62 extension of the last High-Low.


Looking forward into this Week:


Patterns:
Month fork with a Span of 25 years - sees the Price peep above its top Tyne (second chart above).

Support & Resistance:
The Index support and resistance possibilities are shown in the first chart above. 2333 is the support the Bears seek to get below.

Moving Averages:
5 EMA on the Month chart (2265), is the mark, that the Bears have to close below, this month, to impact the up move #MonthlyChart.

Indicators:
TSI above 76.8% Fibo Retrace, helps Bulls #MonthlyChart. 


Wrap:
Bulls peeping above the Long term Channel top, could be negotiating a major breakout #MonthChart.
Desperate Bears may be seeing their darkest hour (before the dawn) and resolution on the first chart should show the way. 


CAC 40 (Europe Paris) - Ichimoku Weekly Study - Tenkan Sen Support works - Week 2 of March 2017.


Zoom into chart .. Click 


Introduction / Primer to Ichimoku can be read at this link (click).


Learning from the Earlier Study: (click here for the previous post)

Index finally takes off from the Tenkan Sen support.

Index took off after ranging in the last few weeks between the 61.8% and 78.6% Fibonacci retrace, of the last major High and Low.
Chikou Span (White) climbs steeply (extreme left).

Wrap:
Index takes off towards the April 2015 High as marked.


Looking Forward into this Week:


Bears want to see the Chikou Span headed back towards the Kumo (extreme left).
Bulls get a range break and maintain Higher High - Higher Low
.
Bears now need to bring the index below the supports marked.

Wrap:


Index in breakout mode, proved its intent to take support and trend up.
Bears would now try to get index below the Tenkan Sen (Center).


SGX Nifty (Asia Singapore) - Ichimoku Weekly Study - Resistance Skirmish - Week 2 of March 2017.


Introduction / Primer to Ichimoku can be read at this link (click).


Learning from the Earlier Study: (click here for the previous post)

Index has a skirmish with the September 2016 High.

Chikou Span (white) above the Price line (see extreme left). 
Tenkan Sen and Kijun Sen make a Bullish Cross.

Wrap:
index takes off from support and is negotiating the previous High - with a Strong Bullish Cross to back it.


Looking Forward into this Week:


Bulls get a Tenkan Sen and Kijun Sen cross - which is a strong Bullish Signal.
Chikou Span - needs to stay above the Price line to keep the Bull move alive.
Bears after defending the September 2016 High - would want  to keep the space.


Wrap: 
Bears would want to defend the current  close and get Index back below Weekly Supports. 

Bulls plan to go Higher on the back of the Bullish 'Tenkan Sen- Kijun Sen Cross'. 


Saturday, March 4, 2017

Brent Crude Oil - Ichimoku Weekly Study - Tenkan Sen Slip - Week 2 of March 2017.


Zoom into chart .. Click


Introduction / Primer to Ichimoku can be read at this link (click).


Learning from the Earlier Study: (click here for the previous post)


Index remains Flat in a range - slips below Support.
Index between the 61.8% and 78.6% Fibo retrace of the last major High & Low.
Chikou Span (white) also goes flat (see extreme left).

Wrap:   

Chikou Span flat, Index is Flat. Last week's candle is a tad below the Tenkan Sen. 


Looking Forward into this Week:

Bulls want to resume the climb and clear $61(Center) for some safety.
Bears want to see Index retest the bottom and aim to reach $24 from here.
The index stays in the range defined - range break imminent.

Wrap: 

Bulls want a breakout and continuation of up trend - $61 sounds good. 
Bears want to see the Index get below the marked supports and retest the recent bottom near $24.