Sunday, January 15, 2012

S&P 500 - End of Week Analysis - between the lines

S&P 500 - EOW Analysis - Week 02-13  Jan 2012.
The last post on this topic anticipated correctly, that the space around the weekly channel top is where the action would be centered - See arrow. We have a green candle hedged by two lines, the week's channel top and the month's channel bottom. Resolution would invoke one of them giving way. The S&P is in an oversold and Bullish state right now. The month targets remain relevant. 

CNX Nifty: Week ending 13 Jan 2012.

Recap: We had a week where the EOD charts saw the Price touch an important Fibonacci level plus a Channel top line rather EXACTLY . The EOW charts had the price closing above the 200 DMA after some time. The Nifty is in a good place now for the Bulls. What next....

Nifty - End of Day Chart - 13  Jan  2012
Nifty End of Day Chart: As already noted we have the price nudging against a rather strong resistance cluster. a daily close above this with good volumes is what Bulls look for.

Nifty - End of Week Chart - 13 Jan 2012
Nifty End of Week Chart: A close above the 200 DMA after so long is good for the Bulls as is the indicator showing above the green resistance/support line, if the indicator can now peek above the 20 mark - one sees the Bulls in serious business.


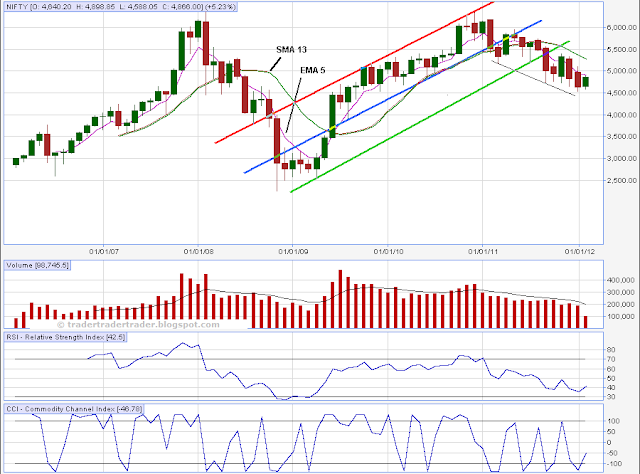
Nifty - End of Month Chart - 13  Jan  2012

Nifty End of Month Chart: A Bullish Harami is what the last two candles indicate at the present moment ... but the point to notice is the up tick in the indicators and the green candle for the month.

Looking Forward: A strong move above the resistances mentioned in the EOD is what one needs to start the week on a Bullish note. The same resistance is important enough to act as the nemesis of the Bulls. Current picture is green for Nifty - so long as its above 4800 it remains green for the next couple of days at-least ... intra week updates shall be up.