


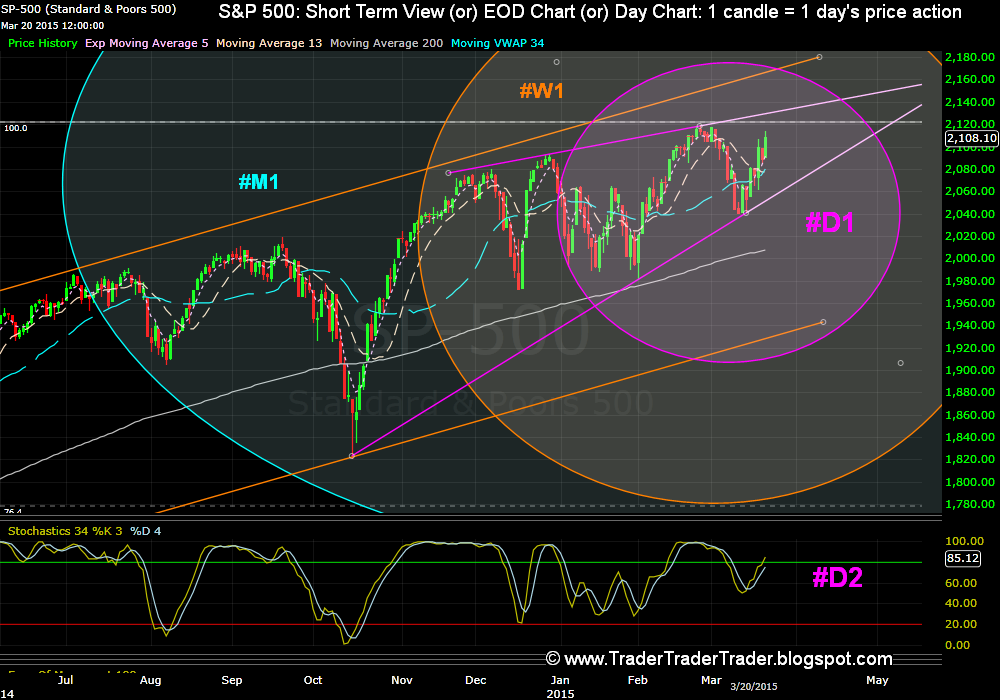
- After triggering a 3 Inside down, on the weekly charts, Bears drive down to the Day channel's bottom - Bulls manage a massive bounce from here #D1.
- This month's candle is a Doji, which has gapped above the previous month as of now #M1..
Support & Resistance:
- Index moves above all the MAs that we track, resistance to beat is the ATH #M1.
Moving Averages:
- The all important, 5 EMA and 13 SMA, on the medium term screen, deflects Bullishly last week #D1.
Indicators:
- RSI 13 is still in the 50s #W2.
Wrap:
Index bounces from support #D1, and heads close to the ATH #M1.
Looking forward into this Week:
Patterns:
- Bears eye the Doji made by this month's candle - hoping for an Evening Star formation #M1.
- Bulls look to History (re-look) #M1 & #M3, and the Day Channel's Bottom line #D1, for a resumption of the Bull run.
Support & Resistance:
- 5 EMA on the Daily Charts #D1, is the support that Bears want to slip below, while the Bulls want to clear the ATH #M1.
- The 5 EMA and 13 SMA on the Week Charts, would stay deflected Bullishly above 2015 #W1.
Indicators:
- TSI, if resisted by the 76.4% Fibonacci retrace, would hold some cheer for the Bulls #M2.
Wrap: