 |
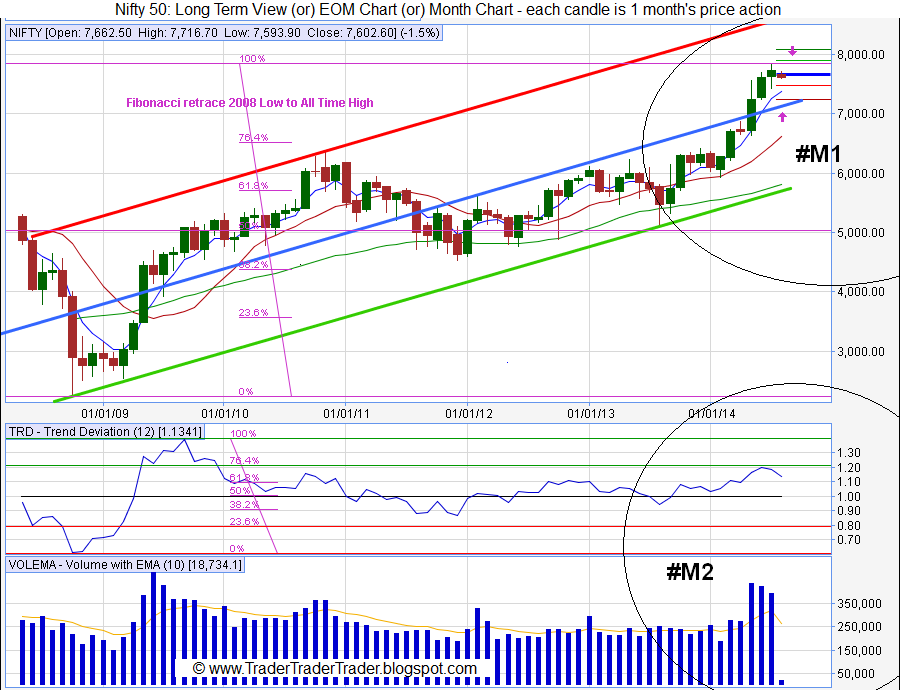
| Nifty 50 - End of Month (EOM) Chart - Channel analyzing Data from 2008 onward - as on 01 Aug'14 |
 |
| Nifty 50 - End of Week (EOW) Chart - Channel analyzing Data from Mid 2011 onward - as on 01 Aug'14 |
 |
| Nifty 50 - End of Day (EOD) Chart - Channel analyzing Data from Feb'2014, onward - as on 01 Aug'14 |
Learning from last Week: (click here for the previous post)
Patterns:
- Last week's Bullish Three Inside Up, formed by a slender 10 point margin fails to deliver #W1.
- July Month candle is a High Wave #M1.
- Bears defend the Day Channel Top #D1 and slip below the 5 EMA on the EOW #W1. Bulls keep it above the 50 SMA #D1.
Moving Averages:
- The critical 5 EMA and 13 SMA on the EOD poised to cross bearishly #D1.
Indicators:
- MACD divergence with Price for the 3rd consecutive wave gives Bears some honey, MACD moves below its MA #D2.
- STS below its resistance line - but remains in the over bought #W1.
Wrap:
Bulls lose control of the short term screen after index keeps below the August Wall 7721 (Study), while Bears further keep it below the August Monthly Pivot 7667 #D1.
Looking Forward into this Week:
Patterns:
Support & Resistance:
- Bulls see support near the 13 SMA on the EOW (7517) #W1, while Index faces resistance at the Month Pivot 7667 #D1.
Moving Averages:
Indicators:
- MACD divergence to Price works for Bears, while the MACD staying above its MA helps Bull cause #D2.
- STS keeping in the overbought is good for the Bulls #W1.
Wrap:
