 |
| Nifty 50 - End of Month (EOM) Chart - Channel analyzing Data from 2008 onward - as on 11 Nov'13 |
 |
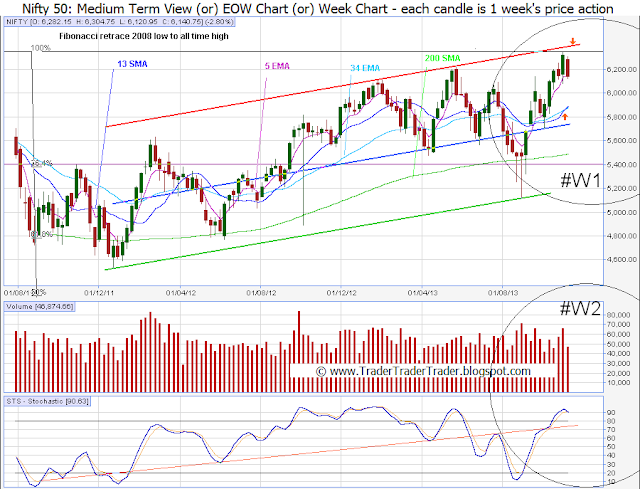
| Nifty 50 - End of Week (EOW) Chart - Channel analyzing Data from Mid 2011 onward - as on 11 Nov'13 |
 |
| Nifty 50 - End of Day (EOD) Chart - Channel analyzing Data from Aug'2013, onward - as on 11 Nov'13 |
Learning from the Past Week: (click here for the previous post)
Patterns:
- Bulls fail to capitalize on the long term 'Three Inside up' #M1 as bears claim honors for the first week of the month.
Support & Resistance:
- Bulls slip below the Channel middle on the EOD #D1 - still above major support - the 34 EMA on the EOD #D1.
- All time High (ATH) #D1, was resistance last couple of weeks.
Moving Averages:
- EOD - 50 SMA and 200 SMA stay crossed bullishly in a Golden Cross #D1.
- Bears force a close a tad below the 5 EMA on EOW #W1.
- STS reaches the over bought - resistance of the previous weeks is now support #W2.
- Divergence (study) of the TRD to Price from last ATH (Oct 2011) to this ATH (Oct 2013) apparent #M2.
Wrap:
Bulls fail to conquer the All time High bearing a Golden Cross - Bears held around Weekly 5 EMA #W1.
Looking Forward into the next Week:
Patterns:
- Bullish 'Three Inside up' (Study link here, here or elsewhere) on the Long Term Chart still active #M1.
- The 34 EMA continues as last major support for the Bulls #D1.
- Week channel top #W1 remains a pretty decent resistance for Bulls.
- Golden Cross (study here, here or elsewhere) 50 & 200 SMA - can give the Bulls some verve to attempt a new ATH.
- Above the 5 EMA on the EOW, #W1 i.e. 6143 Bulls have momentum to attempt another attack on the ATH #W1.
- MACD and its MA are crossed bearishly #D1.
- STS resistance line becomes a strong support on the way down #W2.
Wrap:
Bulls look to make another attempt at the ATH #W1 - Bears look to stay below the 5 EMA on the Medium term charts #W1.
