S&P 500: Long Term View (or) Month Chart (each candle is 1 month's price move) (or) EOM Chart:
 |
| S&P 500 - End of Month Chart (EOM) - 10 Aug, 2012 |
Above is the Month Chart - EOM - analyzing Data from mid 2009, onward.
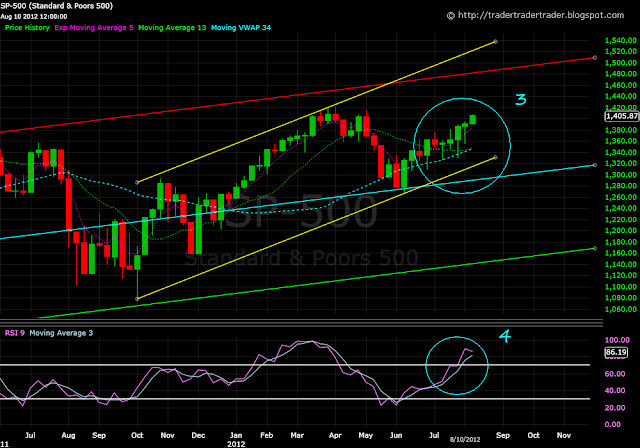
S&P 500: Medium Term View (or) Week Chart (each candle is 1 week's price move) (or) EOW Chart:
 |
| S&P 500 - End of Week Chart (EOW) - 10 Aug, 2012. |
Above is the Week Chart - EOW - analyzing Data from Q3 2011, onward.
S&P 500: Short Term View (or) Day Chart (each candle is 1 day's price move) (or) EOD Chart:
 |
| S&P 500 - End of Day Chart (EOD) - 10 August, 2012. |
Above is the Day Chart - EOD - analyzing Data from Q2 2012, onward.
Learning from the Past Week: (click here for the post)
RSI reading on the EOW (4) - stayed above the 70 mark, Bulls got a green week.
Bears could not paint the Daily candles red intra-week, unlike the previous few weeks (5).
Negative Divergence on the MACD (6) and RSI (4) visible.
Bulls kept it above the 5 EMA and MVWAP 34, on all three screens.
The 'Three Inside Up' (1) has given Bulls a Green time this month.
Looking forward into the next Week:
RSI reading on the EOW (4) - staying above the 70 mark, without the divergence - keeps Bulls in charge.
Bears need to break their nemesis of many weeks, the MVWAP 34 - after moving below the 5 EMA.
The Negative divergences seen on the EOD (6) and EOW (4) are harbingers of a downturn.
Bears would look at the white EOD channel top, giving them some resistance, to come back with, as and when the Index gets there.
Bulls are on a High!
Bulls are on a High!
