Saturday, December 31, 2011

S&P End of Month - December 2011

S&P End of Month - December 2011

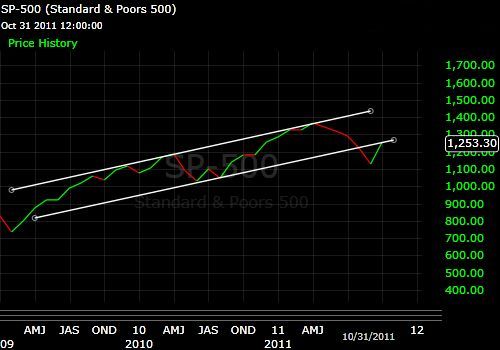
We were studying this chart for October and November this year. Last month we estimated that the 1285  level EOM December is what the long term Bear would throw in the hat at ..... The closing for this month is only 1258.  S&P can continue to make more attempts at breaching the channel's bottom - however the Bears would be impressed only if 1303+ happens to be the closing for Jan 2012. 

S&P 500 - EOW Analysis - Week starting 26 Dec 2011

S&P 500 - EOW Analysis - Week starting 26 Dec 2011
In our last post on this subject we had looked at the possibility of the channel breach happening in 2011 .. one now sees the channels intact as above. Breach or retreat from the upper channel line (of the downward /falling channel)  is what one shall study early next year...

Ichimoku Study - BSE Sensex - End 2011

BSE  Sensex - Month Chart - End of 2011 - with the Ichimoku  Cloud

This study is rather long term - appropriate for a new year - so here is wishing you a happy 2012 :) - happy learning !!

The Ichimoku Cloud is a versatile indicator that defines support, resistance, identifies trend direction, gauges momentum and gives one trading signals.

The Ichimoku parts - see chart above..

The Tenkan Sen - red line
The Kijun Sen - blue line
The Chikou Span - purple line
The Senkou Span A - black line
The Senkou Span B - grey line
The Kumo - grey shaded area

Read up the funda on this at the reference link at the bottom of this post to learn about this indicator..

Our observations using the Monthly chart - each candle is one month - period 2004 to 2011 - 7 year study.
Past:
1. Indian Equity markets were in Bull mode from 2004.
2. The crash of 2008 brought the market into the kumo (grey shade) - just about neutral / flat zone (not even bear zone)!!
3. Since the 2009 rise from the kumo - it was soon back to Bull mode.

Present:
1. We have a weak kijun sen (blue) cross Sell signal as the recent bearish cross happens above the kumo.
2. We have a weak tenkan sen (red) /kijun sen (blue) cross Sell signal - as the bearish cross happens above the kumo.
3. The current close price (as depicted by the chikou span - purple) is lower than the price 26 periods ago,  this indicates that there is a potential for more bearish price action to come.
4. The price is above the Kumo at present and that is Bull zone.
5. There is a Senkou Span Cross coming up which may be Bullish based on present view...

Some useful free links I googled -

To create Ichimoku Charts - if your chart provider does not have it...

http://www.freestockcharts.com/

To learn about the Ichimoku Charts


Update - End of Day : 30 December 2011

Nifty - End of Day Chart - 30 12 2011

Our note at the previous post 'Looking forward' mentions two scenarios - the Bull scenario started off in the first half of  the week and the Bear scenario took over in the second half - there was also a Bullish crossover of the 5 EMA to above the 13 SMA followed by a Bearish cross of the same averages this very same week as seen at the right end  of the chart above. A hard fought week - Bears won.

Sunday, December 25, 2011

Nifty: Week ending - 23rd December 2011

Recap:  We anticipated a change of trend as mentioned in the last post. The combination of an aborted Candle Pattern and channel bottom approaching, culminated in a huge gap up mid week. This was followed by a consolidation above the blue line - finishing the week with equal credit to Bulls and Bears despite a 1+% gain for the week.


Nifty - End of Day Chart - 23 12 2011
Nifty End of Day Chart:  The price moved in our range between the two Fibonacci levels.  staying above the 5 EMA and the blue line we would see the Nifty attempt the upper Fib 61x. Being the settlement week, one expects some wild moves too...


Nifty - End of Week Chart - 23 12 2011
Nifty End of Week ChartWeek candle for the first time in a long while stayed firmly below the 200 DMA. Continuation of such behavior is a recipe for a big crack to the  4200 level. The silver lining is the indicator shown just about staying above the support/resistance line.


Nifty - End of Month Chart - 23 12 2011


Nifty End of Month ChartContinues to be in Bear grip below the 4750 line - throwback to the green channel bottom line - is still a possibility.


Looking Forward:   Staying below last week's high or the 200 Week DMA - one sees the week going deeper into the red .. a quick move early in the week above the 4750 level followed by a dash to the Fib61x level on the Day Chart would be the script the Bulls would look to enforce.

S&P 500 - EOW Analysis - Week starting 19 Dec 2011

S&P - EOW Analysis - Week starting 19 Dec 2011

The Channel made by the weekly candles of the SP500 - one can see that the downward channel is under pressure for some weeks now - but just about holding without a breach of the channel top line - coming week could be a decider....

Wednesday, December 21, 2011

Update - End of Day : 21 December 2011

Nifty - End of Day Chart - 21 12 2011
The inevitable bounce from extremely oversold levels that we were expecting ... Bulls are back in Business .. now for the follow-up, moving above our blue line is next..

Tuesday, December 20, 2011

Update - End of Day : 20 December 2011

Nifty - End of Day Chart - 20 12 2011

Update to our week-end chart -the Price seems to be making a bee-line for our channel bottom .. guess the Bulls would look at holding this line after the morning star failed to shine on them... :)

Monday, December 19, 2011

Update - End of Day : 19 December 2011

Nifty - End of Day Chart - 19 12 2011
Above is the zoom in of the EOD chart we saw last week end - in candle mode - so that one can share a view of the last two candles ... One looks for reversal signs during every trend and so, the last two candles suggest the possibility of a 'Morning Star' Formation ... if not, its good for a revision of the same in the very least...


http://www.investopedia.com/terms/m/morningstar.asp#axzz1gzJs4sbR

http://thepatternsite.com/MorningStar.html

Sunday, December 18, 2011

Nifty: Week ending - 16th December 2011.

RecapOur view 'Looking forward' last weekend was that the Nifty was in a Bear mode ... the directional call in the mid week's post was bearish .... Nifty gave the bears 200+ points last week and made a new low .. and since our premise for the correct call was 'following the trend' and 'moving averages' here is a opportunity to brush up on them ...

Suggestions..


Nifty - End of Day Chart - 16 12 2011


Nifty End of Day Chart: Nifty is mid way the Fib 61x and the Fib 50x - the new channel lines are shown and one expects the Bulls take heart from the less than Bearish close of the US markets ...


Nifty - End of Week Chart - 16 12 2011
Nifty End of Week ChartOur resistance/support line on the Indicator is holding and Bulls would like to use this as a 'take off point' at some stage ... notice that last week's Bearish Harami gave good returns..we have the third weekly close below the 200 DMA this year and as they say .. third time lucky?


Nifty - End of Month Chart - 16 12 2011
Nifty End of Month ChartMonth, like Week and Day are oversold and in deep red...


Looking ForwardBears Rule as of now...change of trend is not apparent on the charts - and  is therefore almost inevitable ... until then its best to be a bear... mid week updates shall be up  ..


S&P Analysis - End of Week starting 12 Dec 2011

S&P Analysis - End of Week starting 12 Dec 2011
Refer our post of last Sunday titled 'S&P - End of Week - 09 Dec 2011'  the resistance line held.. but the candle formation was not to be.. leaving some of those over-enthusiastic Bears a bit miffed ... :)

Friday, December 16, 2011

Update - End of Day : 16 December 2011

Bingo :)


In our last post we choose to go Bear and have learned that it was 250 Nifty points worth ...

Have a nice weekend.....rest of the posts up soon :)

Tuesday, December 13, 2011

Update - End of Day : 13 December 2011


Over the last two days. the index has remained within the range we put in last week... the bearish cross over of the 5 EMA and 13 SMA indicates that the Bears have more to play ..

Sunday, December 11, 2011

Nifty: Week ending - 09th December 2011.


Recap : Refer posts from last weekend (3rd Dec'11) - With the Nifty above the 34 EMA last weekend, we had anticipated a move to our red channel line.. we also expected ranging which happened .. our Intra-Week post of 7th Dec'11, indicated that Bears could make a dash for the Fib61x - which is precisely where the Nifty ended by weekend... 


The Charts...


End of  Day Chart 
Nifty - End of Day Chart - 09 12 2011
Nifty End of Day Chart: Nifty ended on the Fibonacci 61.8% of the 2008 low to 2010 high...as one can see quite a watering spot for the Nifty in recent time...note the range indicated by the arrows...


Nifty - End of Week Chart - 09 12 2011
Nifty End of Week Chart: We see that there is a Bearish Harami in place...in direct contrast we have the indicator taking support on the resistance line...back to class...more about the candle pattern and how to trade it here...


http://thepatternsite.com/HaramiBear.html
http://www.traderslog.com/bearish-harami-weekly-candlestick/


Nifty - End of Month Chart - 09 12 2011

Nifty End of Month Chart: Notice that the Bullish Harami we saw last week disappeared...5 EMA continues to be resistance at which this month is fighting.. a pullback to the green channel line is still a possibility... 


Looking Forward: We analyzed the SP 500 earlier today, we saw the contra signals that this week's study has given us...Currently Nifty is in a Bear mode but on a decent support line... One sees the Nifty ranging as indicated on the Day chart.. based on how the rest of the world opens up we shall take a directional call later in the week...


S&P - End of Week - 09 Dec 2011

SP 500 - End of Week Chart - 09 Dec 2011


The Falling channel formed by the Weekly candles since May 2011, is depicted above...let's look at the last two candles....we have a critical resistance line that the next week's candle needs to fight, to keep the Bulls in business...we also have the possibility of a Evening star formation - if next week's candle opens below this week's candle - as a student of the markets let us then use this excuse to study this pattern at the link below...


So watch out for that resistance line and candle formation....peace!


Saturday, December 10, 2011


Quote for the Week...


Business, more than any other occupation, is a continual dealing with the future; it is a continual calculation, an instinctive exercise in foresight.


Henry R. Luce


Guess that applies to Trading like 100%

Update - End of Day 09 12 2011

BINGO !


The bears closed Nifty exactly on our mark of Fib61x ... Weekly updates up tomorrow, have a good one...


Thursday, December 8, 2011

Update - End of Day 08 12 2011


We feared a 'failure by the Bulls' yesterday (see highlighted text below).. and right on cue, the Bears made that dash to the Fib 61x and are half way there.... staying below today's close the journey resumes tomorrow.. however if Bulls can keep it above today's close they should move the index back towards the 34 EMA.....

Wednesday, December 7, 2011

Update - End of Day 07 12 2011


As mentioned last weekend (post below) we anticipated some ranging around the Blue line - check out the Price line's tip which shows the same... Nifty also stayed above the 34 EMA... Failure by the Bulls to get going now, would invite the Bears to take a dash at our lower mark the Fib 61x ..


Saturday, December 3, 2011

S&P End of Month November 2011

SP-500 End of Month Chart - End November 2011

Last Month's analysis noted that the S&P 500 plunging to our mark on the channel line..on the last trading day was bad news for the Bears....and so it turned out to be...this month we notice that the Price line is hugging the channel bottom and seems inclined to have another go at breaking it....1285 is the mark to beat, End of Month December 2011, for this to happen...

Friday, December 2, 2011

S&P End of Month - October 2011

SP-500 End of  Month Chart - End October 2011


Last Month's Post (from Mailbox)

On Tue, Nov 1, 2011 at 6:57 AM, @gmail.com> wrote:

Hi,

October 2011 ended...we wanted to see if the S&P (US) would pierce the Monthly channel line...see attached chart....on the last day of October, the index fell 2.5% :) to close in what looks exactly like a pullback to channel....leaving the Bulls real worried...(next hope is if November 2011 will close above 1266)...final reading for October 2011 is 1253 (double check with yahoo or other sites) and Bulls wanted the index comfortably above this level on month end ...