Learning from last Week: (click here for the previous post)
Patterns:
Last week's action triggers a "Bullish Harami' #WeekChart1.
Support & Resistance:
Day Fork's middle Tyne sends back the Bulls #DayChart1
Index closes just below the 50 MA #DayChart1.
Moving Averages:
The critical EMA 5, bearishly below the MA 13 on all except month screen #MonthChart1.
Indicators:
The STC stays, well above the 76% Fibonacci retrace #MonthChart2.
Wrap:
Bears close below the 50 MA #DayScreen, Bulls produce a Bullish Harami #WeekChart1.
Looking forward into this Week:
Patterns:
Bullish Harami is active on the week charts (Study links here, here or elsewhere) #WeekChart1. A close above 8698 this week, triggers a 'Three inside up'
Support & Resistance:
Bottom Tyne of the Fork on the Day chart is the first support #DayChart1. The Middle Tyne of the Week Fork is the resistance.
Moving Averages:
The 50 & 200 MA, are a in a 'Golden Cross' on the Day Screen #DayChart1.
Indicators:
The MACD and its histogram, are below zero #DayChart2.
Wrap:
Bears look to stay below the 50 MA and fall below the Day fork #DayChart1.
Bulls want more green with a weekly close above 8698 #Weekchart1.
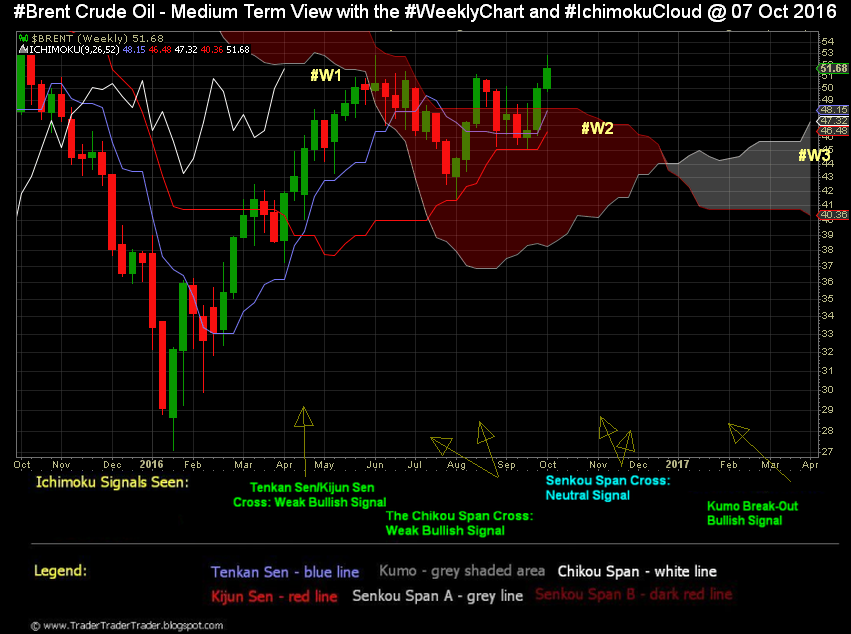
Introduction / Primer to Ichimoku can be read at this link (click).
Learning from the Earlier Study: (click here for the previous post)
Index matches June high after popping above the Kumo #W2.
Chikou Span halts at the Price line, Tenkan Sen at Kumo top #W1,
Bears defend the June high #W2.
Wrap:
Index above the Kumo, draws level with the June high #W2.
Looking Forward into this Week:
Bulls want keep the index above the Kumo and then clear the June high #W2.
Bears want the index below the Tenkan Sen #W2.
Chikou Span nears the price line - bearish cross or bullish deflection on next #W1.
Wrap:
Bears look to use current resistances to get some red on the screen #W2.
Bulls want to keep it clear of the Kumo and get index above the June high #W2.
Learning from last Week: (click here for the previous post)
Patterns:
'Evening Star' pattern triggers on the long term screen #MonthChart1. Septermber candle was a Long Doji.
Support & Resistance:
Resistance was at the middle Tyne of the Week Fork #WeekChart1. Support near the 13 MA on the day charts #Daychart1.
Moving Averages:
The critical EMA 5, is again bearishly below the MA 13, only on the Week Chart #WeekChart1.
Indicators:
The RSI is near the oversold #WeekChart2.
Wrap:
Evening Star triggers on the Month Chart #MonthChart. September candle is a Doji..
Looking forward into this Week:
Patterns:
'Evening Star' Pattern (Study Links here, here or elsewhere) is active on the Long term charts, as the September close was just below 2171 #MonthChart1.
Support & Resistance:
5 EMA on the Week chart i,e, 2161, is the support Bulls want to defend #WeekChart1.
Middle Tyne of the Fork on the Week chart is resistance, that Bulls aim for #WeekChart1.
Moving Averages:
The EMA 5 and MA 13, on the Medium Term Chart cross Bullishly above 2188, a mark the Bears want to defend #WeekChart1.
Indicators:
TSI returns from resistance at the 74% Fibonacci mark #MonthChart2.
Wrap:
Bulls after allowing an Evening Star #MonthChart1, seek a comeback with a move above 2188.
Bears want to keep below the middle Tyne of the Week Fork #WeekChart1 and aim for life below 2161.
Learning from last Week: (click here for the previous post)
Patterns:
Previous Fork breaks, Bears celebrate as index falls below 8804 #DayChart1. Week candle is a Marubozu #WeekChart1.
Support & Resistance:
Index takes support at the Bottom Tyne of the new Day Fork #DayChart1. Resistance was near 8804.
Moving Averages:
The critical EMA 5, bearishly below the MA 13 on all screens #DayChart1.
Indicators:
The STC stays, well above the 76% Fibonacci retrace #MonthChart2.
Wrap:
Index breaks below 8804 and falls fast to the previous weekly low #WeekChart1.
Looking forward into this Week:
Patterns:
Last week's candle the Opening Black Marubozu is active (Study links here, here or elsewhere) #WeekChart1.
Support & Resistance:
Bottom Tyne of the Fork on the Day chart is the first support #DayChart1. The Middle Tyne of the Week Fork is the resistance.
Moving Averages:
The 50 & 200 MA, are a in a 'Golden Cross' on the Day Screen #DayChart1.
Indicators:
The MACD and its histogram, are diving below zero #DayChart2.
Wrap:Bears make a change with a break from the previous 6 green months #MonthChart1.
Bulls want a comeback with a weekly close above 8636 #Weekchart1.