Sunday, March 17, 2013

The Dow Jones - Ichimoku Study - Week: 11 March to 15 March, 2013 - High !


                             .....Regulars can skip below and go straight to the chart......

Introduction can be read at this link (click). 


Quick Reference : 
Chikou Span - pink line,
Kijun Sen - blue line, 
Senkou Span A - black line, 
Senkou Span B - grey line, 
Kumo - grey shaded area,
Tenkan Sen - red line.


Previous Signals seen on DJI 30 - Week Chart (EOW) marked on chart as per notes below

The Kumo Breakout: Strong Bullish  Signal (B)
The Flat Kumo: Bearish Signal (Ko)
The Chikou Span Cross:  Strong Bullish Signal (cC)  
Tenkan Sen Cross:  Strong Bullish Signal (Te)  
The Kijun sen cross:  Strong Bullish Signal (K) 

Last:
The Tenkan Sen/Kijun Sen Cross:  Strong Bullish Signal (T)


Dow 30 - End of  Week Chart (EOW) - Analyzing 12 months Data - as on 15 March'13


Learning from the Past Week: (click here for the post)


Bulls lunge up some more after the same move last week #2..
The Chikou Span #1, increases distance to the price line.
The Oscillator #3 ticks up - divergence with Price continues.


Advantage continues with the Bulls.


Looking Forward into the next Week:

Bears need the index back below the cluster of supports MVWAP 34, Kijun Sen and Tenkan Sen #2.
Bearish Divergence apparent on the Oscillator #3.
Bulls would look at keeping the advantage - keeping clear of the Ichimoku Indicators.


Bears now look for a reversal,  getting below the Tenkan Sen - Bulls look for new highs..


BSE Sensex - Ichimoku Study - Week: 11 March to 15 March, 2013 - Bears Force Retreat


                     .....Regulars can skip below and go straight to the chart......


Introduction / Preamble can be read at this link (click). 


Quick Reference : 

Chikou Span - pink line,
Kijun Sen - blue line, 
Senkou Span A - black line, 
Senkou Span B - grey line, 
Kumo - grey shaded area,
Tenkan Sen - red line.


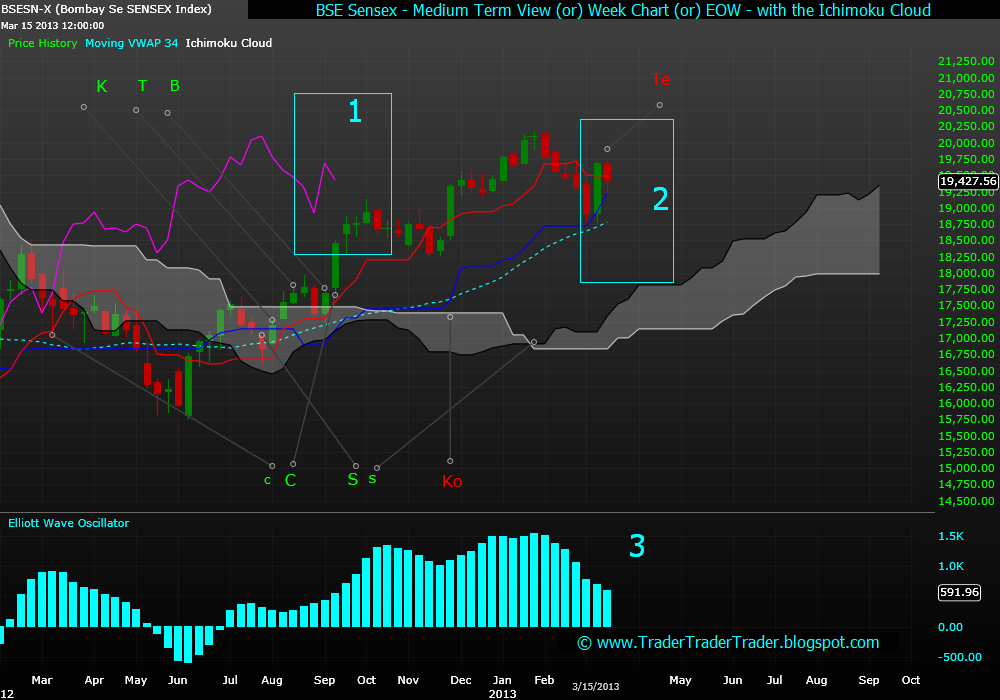
Previous Signals seen on BSE 30 - Week Chart (EOW) marked on chart as per notes below:

The Senoku Span Cross:  Neutral Bullish Signal (Ss)
The Kijun Sen Cross: Neutral Bullish Signal (K)
The Tenkan Sen/Kijun Sen Cross: Strong Bullish Signal (T) 
The Kumo Break-out: Bullish Signal (B)  
The Chikou Span Cross:  Strong Bullish Signal (Cc)  
The Flat Kumo: Bearish Signal (Ko)

New:
The Tenkan Sen Cross:  Bearish Signal (Te)


BSE 30 - End of  Week Chart (EOW) - Analyzing 12 months Data - as on 15 March'13


Learning from the Past Week: (click here for the post)

Bulls use support at the Kijun Sen to prevent a crash #2.
Bears bring index below the Tenkan Sen again #2.
Oscillator ticks down #3.
Chikou Span again heads towards the Price line #1.


Bulls and Bears even on the medium term Screen.


Looking Forward into the next Week:

Staying above the Kijun Sen - Bulls have some relief #2.
Bears see strength, below the Tenkan Sen #2.
Chikou Span meeting price line is good for Bears #1.


A Bearish / Bullish Cross of the Tenkan Sen and Kijun Sen, is the next action point to watch.


Sunday, March 10, 2013

S&P 500 - Triple Screen 'Technical Analysis' - Week: 04 March to 08 March, 2013 - Triple Tops & Channel Pops


S&P 500 - End of  Month Chart (EOM) - Channel showing the Triple Top - from 1999 - as on 08 March'13


S&P 500 - End of  Month Chart (EOM) - Channel analyzing Data from mid 2009, onward - as on 08 March'13


S&P 500 - End of  Week Chart (EOW) - Channel analyzing Data from OND, 2011 onward - as on 08 March'13


S&P 500 - End of  Day Chart (EOD) -  Channel analyzing Data from Nov'2012, onward - as on 08 March'13


Learning from the Past Week:  (click here for the post)

Price Pops above the Month Channel Top - #M1, #W1 & #D1 - Bulls on a roll..
Triple top on Long Term Charts - #1, #2, & #3, a matter of solace for Bears.
Earlier in the week, the MAs we were watching - cross to give the Bulls required momentum #D1.
White arrows #D1 indicate the confluence of the all time high made by the SP500 and the Day channel - our next resistance.
RSI #W2, and its MA re-cross bullishly & the action at the STS #M2 emphasize the Bull's Long Term Strength.
Bulls have all the three screens now. 


Bulls control all three screens - Bears have the Triple Top to talk about.


The Ellipses marked #M1, #W1 and #D1 indicate the hot spots on the long, medium and short term charts respectively.
As one can see - we are zooming into the action starting #M1 through #W1 and get up close in #D1.


Looking forward into the next Week:

Month channel's, top red line #M1, is now support for the Bulls.
Price heading for the all time high of the SP500 - see white arrows #D1.
Getting the price, below the 5 EMA on the EOW #3, is the next task for the Bears.
Triple Top on the Long Term Screen, remains the bane of the Bulls for some more time.
Triple tops can be studied here, here or anywhere else, should you need a recap.
Bulls for now rule the screens..


Month Channel's red Top Line is now support and the two white arrows on the Day Screen #D1 shows possible resistance.


CNX Nifty 50 - Triple Screen 'Technical Analysis' - Week: 04 March to 08 March, 2013 - Mid Channel bounce


Nifty 50 - End of Month (EOM) Chart - Channel analyzing Data from 2008 onward - as on 08 March'13


Nifty 50 - End of  Week (EOW) Chart - Channel analyzing Data from Mid 2011 onward - as on 08 March'13


Nifty 50 - End of  Day  (EOD) Chart - Channel analyzing Data from Nov' 2012, onward - as on 08 March'13


Learning from the Past Week: (click here for the post)

We saw the 76.4% Fibonacci retrace of the last low (Jan'12) from Nifty's all time high #1, as resistance and the 61.8% the support, last week.
Price took off from the above support and closed just above the resistance 76.4% Fib #1.
Channel Middle line #3, was the support that the Bears could not beat last week.
Day channel #5, sees the Price taking support at the the channel bottom.
Bouncing from the green bottom line of the EOD channel #5 - Bulls did retake the short term screen.
Position of the STS on the EOW, showed that the Bulls are around for a comeback #4.


Bouncing from the Medium Term Channel's Middle Line #3, price is now at the 50 SMA on the EOD #5. 


Looking Forward into the next Week:

Channel Middle (blue) and 34 EMA on the EOW, continues as the new support for Bulls #3.
2 crows pattern that we studied last few weeks, completes its targets.
50 SMA and 200 SMA, convergence towards a death cross to be watched #5.
Keeping above the 76.4% Fibonacci retrace of the last low (Jan'12) from Nifty's all time high #1 - is important for Bulls to get a shot at new Highs.
Support line on the STS #4, worth a watch. 


The 76.4% Fibonacci retrace (5919) of the last low (Jan'12) from Nifty's all time high #1, is back as support and the EOW channel top #3 as resistance


Saturday, March 9, 2013

The Dow Jones - Ichimoku Study - Week: 04 March to 08 March, 2013 - Bulls make Up move..


                             .....Regulars can skip below and go straight to the chart......

Introduction can be read at this link (click). 


Quick Reference : 
Chikou Span - pink line,
Kijun Sen - blue line, 
Senkou Span A - black line, 
Senkou Span B - grey line, 
Kumo - grey shaded area,
Tenkan Sen - red line.


Previous Signals seen on DJI 30 - Week Chart (EOW) marked on chart as per notes below

The Kumo Breakout: Strong Bullish  Signal (B)
The Flat Kumo: Bearish Signal (Ko)
The Chikou Span Cross:  Strong Bullish Signal (cC)  
Tenkan Sen Cross:  Strong Bullish Signal (Te)  
The Kijun sen cross:  Strong Bullish Signal (K) 

Last:
The Tenkan Sen/Kijun Sen Cross:  Strong Bullish Signal (T)


Dow 30 - End of  Week Chart (EOW) - Analyzing 12 months Data - as on 08 March'13


Learning from the Past Week: (click here for the post)


Bulls lunge up after mulling the move last week #2..
The Chikou Span #1, retains distance to the price line.
The Oscillator #3 ticks up marginally - divergence with Price continues.


Advantage now with the Bulls.


Looking Forward into the next Week:

Bears need the index back below the cluster of supports MVWAP 34, Kijun Sen and Tenkan Sen #2.
Bearish Divergence apparent on the Oscillator #3.
Bulls would look at keeping the advantage - keeping clear of the Ichimoku Indicators.


Bears now look for a reversal,  crossing of the Tenkan Sen and the Kijun Sen - in the slightly distant future..