Sunday, February 24, 2013

S&P 500 - Triple Screen 'Technical Analysis' - Week: 18 February to 22 February, 2013 - Bears defend Channel Top Again..


S&P 500 - End of  Month Chart (EOM) - Channel analyzing Data from mid 2009, onward - as on 15 Feb'13


S&P 500 - End of  Week Chart (EOW) - Channel analyzing Data from OND, 2011 onward - as on 15 Feb'13


S&P 500 - End of  Day Chart (EOD) -  Channel analyzing Data from Nov'2012, onward - as on 15 Feb'13


Learning from the Past Week:  (click here for the post)

Month Channel top resistance, seen at #D1, #W1 & #M1 once again sends back the Bulls, a red week seen.
#D2 and #W2 show Divergence.
#M1, #W1, #D1 - show us that the Month Channel's red top line, clearly stop the price line.
5 EMA and 13 SMA on the EOD charts #D1, which was seen converging last week, cross bearishly.
RSI #W2, and its MA cross bearishly while still in the oversold.
Bears wrest the short term screen from the Bulls #D1 & #D2.
#D1 shows the price line taking support on the MVWAP 34 - exactly as anticipated last week.


Watch of the Month/Day Channel's top red line #M1, #D1 and the Divergences #D2 & #W2, paid off .. support on the 34 MVWAP #D1 also worth a watch.


The Ellipses marked #M1, #W1 and #D1 indicate the hot spots on the long, medium and short term charts respectively.
As one can see - we are zooming into the action starting #M1 through #W1 and get up close in #D1.


Looking forward into the next Week:

Month channel's, top red line #M1, continues to be resistance for Bulls.
The MVWAP 34 on the EOD, #D1, remains the support.
Bullish cross of the 13 SMA with 5 EMA on the Day charts #D1 critical for the Bull.
Sliding the price, below the 5 EMA on the EOW #3, is the next task for the Bear.


Month Channel Top continues as the critical resistance - #M1..


CNX Nifty 50 - Triple Screen 'Technical Analysis' - Week: 18 February to 22 February, 2013 - 2 Crows' @ Feb end..


Nifty 50 - End of Month (EOM) Chart - Channel analyzing Data from 2008 onward - as on 15 Feb'13


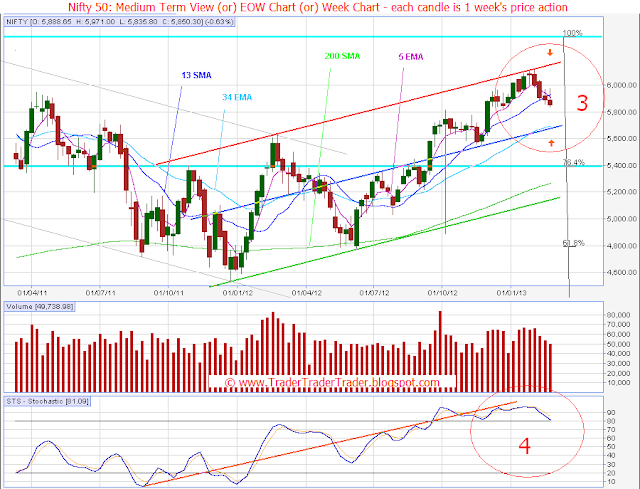
Nifty 50 - End of  Week (EOW) Chart - Channel analyzing Data from Mid 2011 onward - as on 15 Feb'13


Nifty 50 - End of  Day  (EOD) Chart - Channel analyzing Data from Nov' 2012, onward - as on 15 Feb'13


Learning from the Past Week: (click here for the post)

Channel Top Stop on the EOW #3, remains the nemesis of Bulls for yet another week.
2 crows pattern which we studied, gives the Bears #3 - more gains.
Day channel #5 (new) sees the Price taking support at the the channel bottom.
50 SMA and 200 SMA converge - on the EOD charts #5.
MACD Histogram shows positive divergence to price #6.
Bears get a bearish cross of the 13 SMA and 5 EMA on the Medium term screen #3.
Position of the STS in the oversold shows that the Bulls are around for a comeback #4.
Bulls take support on the 5 EMA on the EOM #1.


Our mark for the week 5969 was the top made by the Index last week, the bearish cross of the 5 EMA & 13 SMA on the EOW #3 results - Vigilant Bears get their honey..


Looking Forward into the next Week:

Channel top on the EOW, remains a major resistance #3.
Bouncing from the green bottom line of the new EOD channel #5 - Bulls could attempt a retake of the short term screen.
Index giving a bullish cross of the 5 EMA and the 13 SMA on the EOW #3, is critical for Bulls.
2 crows pattern that we studied last few weeks, to be followed up for its targets.
50 SMA and 200 SMA convergence towards a death cross to be watched #5.
Getting above the 76.4% Fibonacci retrace of the last low (Jan'12) from Nifty's all time high #1 - by month end (5919) - is important for Bulls to get a shot at new Highs.


Using the Bottom Channel line of the Day Channel #5, and the 5 EMA on the EOM #1, Bulls can look for a throwback towards the 50 SMA on the EOD #5.


Saturday, February 23, 2013

The Dow Jones - Ichimoku Study - Week: 18 February to 22 February, 2013 - Stalemate..


                             .....Regulars can skip below and go straight to the chart......

Introduction can be read at this link (click). 


Quick Reference : 
Chikou Span - pink line,
Kijun Sen - blue line, 
Senkou Span A - black line, 
Senkou Span B - grey line, 
Kumo - grey shaded area,
Tenkan Sen - red line.


Previous Signals seen on DJI 30 - Week Chart (EOW) marked on chart as per notes below

The Kumo Breakout: Strong Bullish  Signal (B)
The Flat Kumo: Bearish Signal (Ko)
The Chikou Span Cross:  Strong Bullish Signal (cC)  
Tenkan Sen Cross:  Strong Bullish Signal (Te)  
The Kijun sen cross:  Strong Bullish Signal (K) 

Last:
The Tenkan Sen/Kijun Sen Cross:  Strong Bullish Signal (T)


Dow 30 - End of  Week Chart (EOW) - Analyzing 12 months Data - as on 15 Feb'13


Learning from the Past Week: (click here for the post)


Bulls and Bears level up #2 for the third week in a row..
The Chikou Span #1 flattens - nearer now to the price line.
The Oscillator #3 ticks up - divergence with Price continues.


Bears & Bull are deadlocked again - Advantage still with the Bears.


Looking Forward into the next Week:

Bears need the index back below the cluster of supports MVWAP 34, Kijun Sen and Tenkan Sen #2.
Bearish Divergence apparent on the Oscillator #3.


Bears keep a slim advantage and some hope of recrossing the red Tenkan Sen.


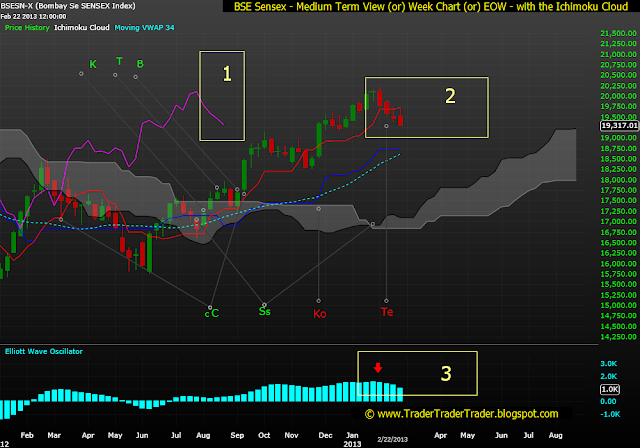
BSE Sensex - Ichimoku Study - Week: 18 February to 22 February, 2013 - Bears defend the Tenkan Sen..


                     .....Regulars can skip below and go straight to the chart......


Introduction / Preamble can be read at this link (click). 


Quick Reference : 

Chikou Span - pink line,
Kijun Sen - blue line, 
Senkou Span A - black line, 
Senkou Span B - grey line, 
Kumo - grey shaded area,
Tenkan Sen - red line.


Previous Signals seen on BSE 30 - Week Chart (EOW) marked on chart as per notes below:

The Senoku Span Cross:  Neutral Bullish Signal (Ss)
The Kijun Sen Cross: Neutral Bullish Signal (K)
The Tenkan Sen/Kijun Sen Cross: Strong Bullish Signal (T) 
The Kumo Break-out: Bullish Signal (B)  
The Chikou Span Cross:  Strong Bullish Signal (Cc)  
The Flat Kumo: Bearish Signal (Ko)

Last:
The Tenkan Sen Cross:  Weak Bearish Signal (Te)  


BSE 30 - End of  Week Chart (EOW) - Analyzing 12 months Data - as on 15 Feb'13


Learning from the Past Week: (click here for the post)

Bears keep the Index below the Tenkan Sen #2 - again.
Oscillator ticks down and Divergence to Price continues #3.
Chikou Span dives towards the Price line #1


Bears follow up the break of the Tenkan Sen last week, with another red candle, to retain the Medium term Screen.


Looking Forward into the next Week:

Staying above the blue Kijun Sen - Bulls still have an edge.
Bears see strength, staying below the Tenkan Sen #2.


Bulls need to re-conquer the Tenkan Sen to get back some Strength..


Sunday, February 17, 2013

S&P 500 - Triple Screen 'Technical Analysis' - Week: 11 February to 15 February, 2013 - Channel Top Holds Again..


S&P 500 - End of  Month Chart (EOM) - Channel analyzing Data from mid 2009, onward - as on 15 Feb'13


S&P 500 - End of  Week Chart (EOW) - Channel analyzing Data from OND, 2011 onward - as on 15 Feb'13


S&P 500 - End of  Day Chart (EOD) -  Channel analyzing Data from Nov'2012, onward - as on 15 Feb'13


Learning from the Past Week:  (click here for the post)

Channel top resistance #D1, again - holds the Bulls, an even smaller green week ensues.
#D2 and #W2 shows that Divergence persists.
#M1, #W1, #D1 - show us that the Month Channel's red top line, is almost at the price line.
5 EMA and 13 SMA on the EOD charts #D1, again converge..
RSI #W2, moves into oversold.
Bulls remain on top on all the three screens as of now.
#D1 shows the price line hesitating at the Month Channel's Red Top line - for the last few days..


Bulls are on top but slow down a bit more .. watch of the Month/Day Channel's top red line #M1/#D1 and the Divergences #D2 & #W2, continues.


The Ellipses marked #M1, #W1 and #D1 indicate the hot spots on the long, medium and short term charts respectively.
As one can see - we are zooming into the action starting #M1 through #W1 and get up close in #D1.


Looking forward into the next Week:

Day channel's, top red line #D1, continues to be resistance for Bulls.
The MVWAP 34 on the EOD, #D1is the likely support.
Possibility of a MA cross or continuing deflection of the 13 SMA with 5 EMA on the Day charts #D1 worth watching.
Month Channel top #M1 continues to be of critical importance as the next major resistance to beat.


Month Channel Top continues as the critical resistance - #M1..


CNX Nifty 50 - Triple Screen 'Technical Analysis' - Week: 11 February to 15 February, 2013 - 2 Crows' Fall Xtends...


Nifty 50 - End of Month (EOM) Chart - Channel analyzing Data from 2008 onward - as on 15 Feb'13


Nifty 50 - End of  Week (EOW) Chart - Channel analyzing Data from Mid 2011 onward - as on 15 Feb'13


Nifty 50 - End of  Day  (EOD) Chart - Channel analyzing Data from Nov' 2012, onward - as on 15 Feb'13


Learning from the Past Week: (click here for the post)

Channel Top Stop on the EOW #3, remains the nemesis of Bulls for another week.
2 crows pattern which we studied, continues to work for the Bears #3.
Day channel #5 sees price break below the channel bottom - next week's channel also shown.
Index slips below the 34 EMA and 50 SMA on the EOD charts #5.
MACD Histogram ticks up #6.
Bears break the support on the 13 SMA #3 - a strong place and head for a bearish cross of the 13 SMA and 5 EMA on the Medium term screen.
Position of the STS in the oversold shows that the Bulls are around for a comeback #4.


Bears retain control of the short & medium term.. 


Looking Forward into the next Week:

Channel top on the EOW, remains a major resistance #3.
Bouncing from the green bottom line of the new EOD channel #5 - Bulls could attempt a retake of the short term screen.
Index climbing back above the 13 SMA on the EOW #3, is critical for Bulls.
2 crows pattern that we studied last week to be followed up for its targets.
50 SMA and 200 SMA converge - see EOD, after a long time - too much of this would result in a death cross.
Getting above the 76.4% Fibonacci retrace of the last low (Jan'12) from Nifty's all time high #1 - by month end - is important for Bulls to get a shot at new Highs.


Taking the index above 5969 to prevent the Bearish MA cross ( 13 SMA & 5 EMA) on the EOW Charts #3,  would keep the Bull in contention for a Bounce in the coming week..


Saturday, February 16, 2013

The Dow Jones - Ichimoku Study - Week: 11 February to 15 February, 2013 - Stand off..


                             .....Regulars can skip below and go straight to the chart......

Introduction can be read at this link (click). 


Quick Reference : 
Chikou Span - pink line,
Kijun Sen - blue line, 
Senkou Span A - black line, 
Senkou Span B - grey line, 
Kumo - grey shaded area,
Tenkan Sen - red line.


Previous Signals seen on DJI 30 - Week Chart (EOW) marked on chart as per notes below

The Kumo Breakout: Strong Bullish  Signal (B)
The Flat Kumo: Bearish Signal (Ko)
The Chikou Span Cross:  Strong Bullish Signal (cC)  
Tenkan Sen Cross:  Strong Bullish Signal (Te)  
The Kijun sen cross:  Strong Bullish Signal (K) 

Last:
The Tenkan Sen/Kijun Sen Cross:  Strong Bullish Signal (T)


Dow 30 - End of  Week Chart (EOW) - Analyzing 12 months Data - as on 15 Feb'13


Learning from the Past Week: (click here for the post)


Bulls and Bears stand off #2, after last week's, Bearish Harami, with a lower close !
The Chikou Span #1 dips again - still way above the price line.
The Oscillator #3 ticks up - divergence with Price continues.


Bears & Bull stand off for this week - Advantage Bears.


Looking Forward into the next Week:

Bears need the index back below the cluster of supports MVWAP 34, Kijun Sen and Tenkan Sen #2.
Bearish Divergence apparent on the Oscillator #3.


A lower close last week, has given the Bears hope of recrossing the red Tenkan Sen Line #2.


BSE Sensex - Ichimoku Study - Week: 11 February to 15 February, 2013 - Bears Roll down some more..


                     .....Regulars can skip below and go straight to the chart......


Introduction / Preamble can be read at this link (click). 


Quick Reference : 

Chikou Span - pink line,
Kijun Sen - blue line, 
Senkou Span A - black line, 
Senkou Span B - grey line, 
Kumo - grey shaded area,
Tenkan Sen - red line.


Previous Signals seen on BSE 30 - Week Chart (EOW) marked on chart as per notes below:

The Senoku Span Cross:  Neutral Bullish Signal (Ss)
The Kijun Sen Cross: Neutral Bullish Signal (K)
The Tenkan Sen/Kijun Sen Cross: Strong Bullish Signal (T) 
The Kumo Break-out: Bullish Signal (B)  
The Chikou Span Cross:  Strong Bullish Signal (Cc)  
The Flat Kumo: Bearish Signal (Ko)

New:
The Tenkan Sen Cross:  Weak Bearish Signal (Te)  


BSE 30 - End of  Week Chart (EOW) - Analyzing 12 months Data - as on 15 Feb'13


Learning from the Past Week: (click here for the post)

Bears after taking out the Tenkan Sen, stay down  #2.
Oscillator ticks down and Divergence to Price continues #3.
Chikou Span dives towards the Price line #1


Bears follow up the break of the Tenkan Sen last week, with another red candle, to keep the Medium term Screen.


Looking Forward into the next Week:

Staying above the Kijun Sen - Bulls hold the edge.
Bears see strength, staying below the Tenkan Sen #2.


The now, not so distant possibility of a Bearish, 'Kijun Sen - Tenkan Sen' Cross continues to be the Bear Hope..


Sunday, February 10, 2013

S&P 500 - Triple Screen 'Technical Analysis' - Week: 04 February to 08 February, 2013 - Channel Top Hold


S&P 500 - End of  Month Chart (EOM) - Channel analyzing Data from mid 2009, onward - as on 08 Feb'13


S&P 500 - End of  Week Chart (EOW) - Channel analyzing Data from Aug' 2011 onward - as on 08 Feb'13


S&P 500 - End of  Day Chart (EOD) -  Channel analyzing Data from Nov'2012, onward - as on 08 Feb'13


Learning from the Past Week:  (click here for the post)

Channel top resistance #D1, again - holds the Bulls, a smaller green week ensues.
#D2 and #W2 shows that Divergence persists.
#M1, #W1, #D1 - show us that the Month Channel's red top line, is almost at the price line.
5 EMA and 13 SMA on the EOD charts #D1, mildly deflect - cross still an option.
RSI #W2, moves into oversold.
Bulls remain on top on all the three screens as of now.


Bulls are on top but slow down a bit .. watch the Month/Day Channel's top red line #M1/#D1 and the Divergences #D2 & #W2.


The Ellipses marked #M1, #W1 and #D1 indicate the hot spots on the long, medium and short term charts respectively.
As one can see - we are zooming into the action starting #M1 through #W1 and get up close in #D1.


Looking forward into the next Week:

Day channel's, top red line #D1, continues to be resistance for Bulls.
The MVWAP 34 on the EOD, #D1is the likely support.
RSI #W2, causing another 'Lower High' is not good for Bulls.
Possibility of a MA cross or continuing deflection of the 13 SMA with 5 EMA on the Day charts #D1 worth watching.
Month Channel top #M1 assumes critical importance as the next major resistance to beat.


Month Channel Top is a critical resistance - #M1..


CNX Nifty 50 - Triple Screen 'Technical Analysis' - Week: 4 February to 08 February, 2013 - 2 Crows' Fall..


Nifty 50 - End of Month (EOM) Chart - Channel analyzing Data from 2008 onward - as on 08 Feb'13


Nifty 50 - End of  Week (EOW) Chart - Channel analyzing Data from Mid 2011 onward - as on 08 Feb'13


Nifty 50 - End of  Day  (EOD) Chart - Channel analyzing Data from Nov' 2012, onward - as on 08 Feb'13


Learning from the Past Week: (click here for the post)

Channel Top Stop on the EOW #3, becomes the nemesis of Bulls.
2 crows pattern which we studied last week works for the Bears #3.
Day channel #5 with the arrows, show us the resistance and supports to watch out for, next week.
Index slips below the 34 EMA and 50 SMA on the EOD charts #5.
MACD visits the zero line #6
Bulls find support on the 13 SMA #3 EOW - a strong place.


Bulls lose control of the short & medium term even as the Bears rev up some momentum after bouncing off the Week Channel's top line and the 2 crows pattern #3.


Looking Forward into the next Week:

Channel top on the EOW, remains a major resistance #3.
Bouncing from the green bottom line of the EOD channel #5 - Bulls could attempt a retake of the short term screen.
Index keeping above the 13 SMA on the EOW #3, is critical for Bulls.
2 crows pattern that we studied last week to be followed up.
50 SMA and 200 SMA converge after a long time - too much of this would result in a death cross.
Getting above the 76.4% Fibonacci retrace of the last low (Jan'12) from Nifty's all time high #1 - is important for Bulls to get a shot at new Highs.


Keeping the index above the 13 SMA on the EOW Charts #3 keeps the Bull in contention for a Bounce..