Tuesday, February 13, 2018

CAC 40 (Europe Paris) - Étude de la semaine, Ichimoku - Kumo atterrissage - Mid Week 3 of February 2018


Investing.com chart / graphique > Click

Introduction & Primer to Ichimoku can be read at this link > click.
Introduction & Primer à Ichimoku peut être lu sur ce lien> cliquez.


PAST

Bulls, after being stopped at the Double Top, see red, but manage to hold above the last (major) low of 4995.
Senkou Span A (Kumo's green border), is resistance this week.


Les Bulls, après avoir été arrêtés au Double Top, voient le rouge, mais parviennent à se maintenir au-dessus du dernier plus bas de 4994.
Senkou Span A (la frontière verte de Kumo), c'est la résistance cette semaine.


NEXT

Chikou Span, bouncing off the Price Line, will give the respite to the Bulls.
Base formation in the Kumo, especially above 4995 gives the Bulls a fighting chance.


Chikou Span, rebondissant sur la ligne de prix, donnera le répit aux Bulls.
La formation de base dans le Kumo, surtout au-dessus de 4995 donne aux Bulls une chance de se battre.


WRAP

Bears, want to breach 4995 and dive to the 2016 low (3892).
Bulls seek to maintain the 'Higher High - Higher Low', and a escape out of the Kumo.


Bears, veulent faire une brèche 4995 et plonger au plus bas de 2016 (3892).
Les taureaux cherchent à maintenir le «plus haut haut - plus haut bas», et une évasion hors du Kumo.


Translation Credits :)
https://translate.google.com


BitCoin, BTC/USD - Ichimoku Chart Study - Fibonacci 61.8% and a Hammer - Mid Week 3 of February 2018.


Investing.com
 
chart > 
Click

Introduction & Primer to Ichimoku can be read at this link > click.
 

PAST

BitCoin falling from the All Time High, makes a Lower Low (see center) and takes support at the 61.8% Fibonacci retrace of the $0 to All Time High as marked.
The previous week's candle was a Hammer >> Link.


NEXT

Bears after striking below the 0.618 Fibonacci Retrace (sub 7600), seek the Kumo (cloud).
Bulls need to take support at this critical level and move up to the Tenkan Sen (blue line).


WRAP


Bears hope for life below the 0.618 Fibonacci and aim for the Kumo.
Bulls seek to retrace from the 61.8% Fibo and reach the Blue line (12945).


Monday, February 12, 2018

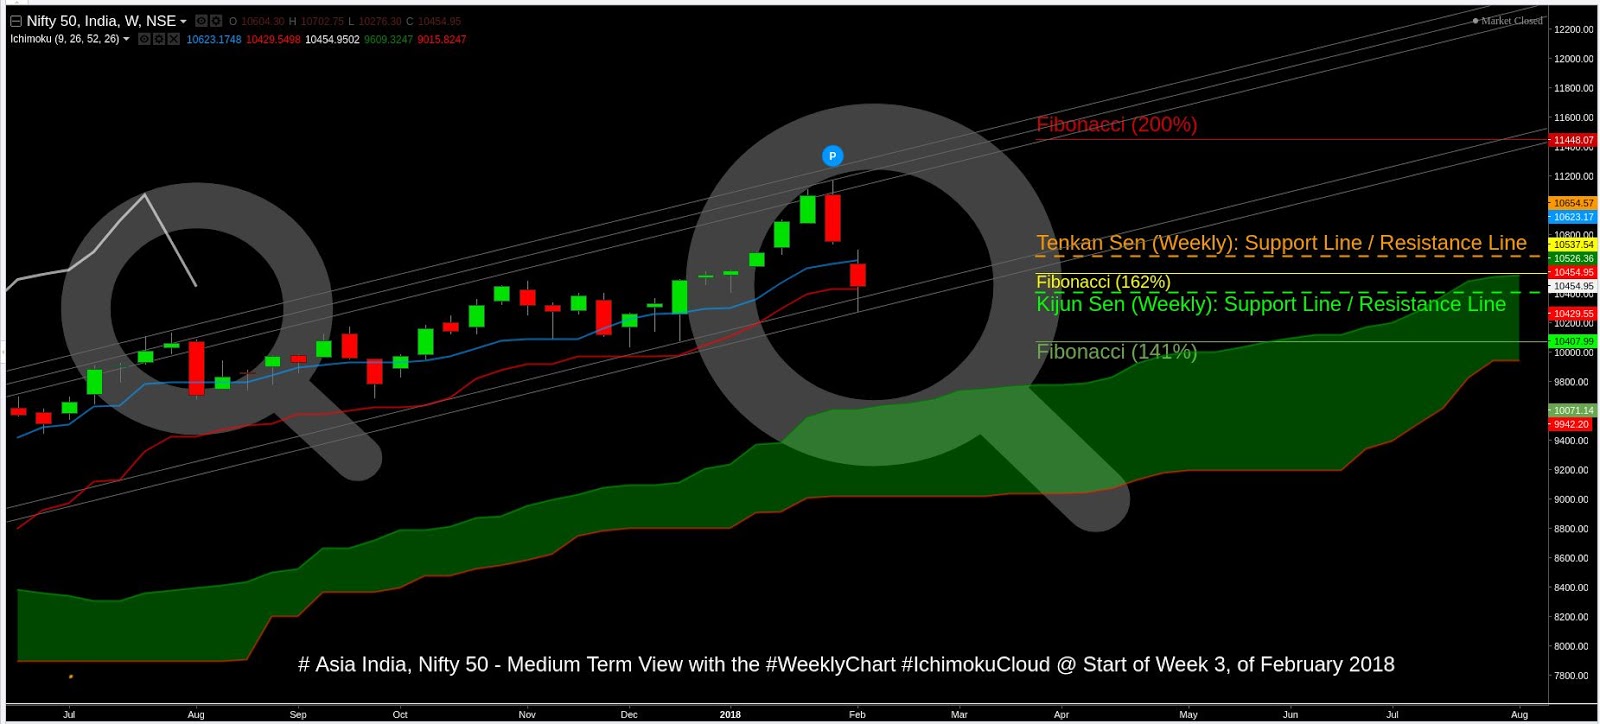
Nifty (Asia India) - Ichimoku Weekly Study - Channel Bottom Reprive - Start of Week 3 of February 2018


Investing.com
 
chart > 
Click

Introduction & Primer to Ichimoku can be read at this link > click.
 

PAST

Index falls back to Channel Support near the 162% Fibonacci (of the 2015 low to 2016 high) after being sent back by the Channel Resistances shown.
Index attempts to keep above the Red Kijun Sen Support (10434), at this point in time.


NEX


Bulls hope to hold on to the cluster of support lines shown.
Bears want to force a lower low after breaking the red support line (10434) above.


WRAP


Bulls seek to use current support, to keep above the Kijun Sen and target the 200% Fibonacci once again.
Bears, seek to keep up the momentum, with a 'lower low' (sub 10033).


Saturday, February 10, 2018

Brent Oil - Ichimoku Weekly Chart Study - Stick Sandwich Bears Honey - Week 2 of February 2018.


Investing.com
 
chart > 
Click


Introduction & Primer to Ichimoku can be read at this link > click.
 

PAST

Index dives to $62 as Bears get their Honey, from the Stick Sandwich Pattern >> Link.
Bulls find support near the Kijun Sen (Red Line).
Brent manages to keep above the 'Higher Low' with this close.


NEXT

Bulls, pray they can maintain the Higher Low and resume the up-move from here.
Bears, want life below the red line for starters.


WRAP


Bears hope the momentum of the fall, will lead to more red and life near the Kumo ($50).
Bulls seek to use the current support to get back above the Tenkan Sen (Blue Line). 


Monday, February 5, 2018

Nifty (Asia India) - Ichimoku Weekly Study - Engulfed by Channel Resistances - Start of Week 2 of February 2018


Investing.com
 
chart > 
Click

Introduction & Primer to Ichimoku can be read at this link > click.
 

PAST

Index falls back to support at the 162% Fibonacci (of the 2015 low to 2016 high) after being sent back by the Channel Resistances shown.
Index attempts to keep above the Blue Tenkan Sen Support (10626), at this point in time.


NEX

Bulls hope to stop falling at the cluster of support lines shown.
Bears want to force a lower low after breaking the red support line (10434) above.


WRAP


Bulls seek to use current support, to keep above the Tenkan Sen and target the 200% Fibonacci once again.
Bears, after the Channel resistances gave them a massive red candle, now seek to make a lower low (sub 10033).