Monday, April 24, 2017

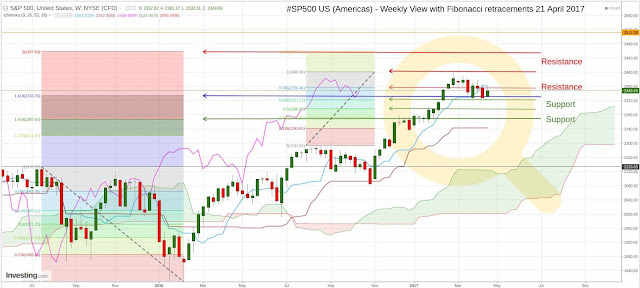
S&P 500 (Americas, USA) - 'Weekly Technical Analysis' - Support Works - Week 4 of April 2017.


Zoom into chart .. Click 


Learning from last Week:  (click here for the previous post)

Index takes off from Support at the 1.62 extension as marked above.
The Blue weekly 'Tenkan Sen' is resistance currently.

Wrap: 

The Index rises from Support to the Tenkan Sen (Blue line).


Looking forward into this Week:

Bears need to get below the 1.62 extension - marked above.
Bulls seek Higher Highs, with help from the Piercing  Pattern and off current support.
Index Support and Resistance possibilities are marked as above. 


Wrap:
Bulls look to crack the Tenkan Sen staying above current support at the 1.62 Fibonacci.
Bears hope to restart the downward momentum, seek to change the trend


CAC 40 (Europe Paris) - Ichimoku Weekly Study - Tenkan Sen Support - Week 4 of April 2017.


Zoom into chart .. Click 


Introduction / Primer to Ichimoku can be read at this link (click).


Learning from the Earlier Study: (click here for the previous post)

Bulls bounce off the Tenkan Sen last week, and now have an option of making this a higher low.

Index has made a Higher High and above all indicators.
Chikou Span (White) dips towards Price line (extreme left).

Wrap:
Index after the Evening Star, takes support at the Tenkan Sen(Blue Line).


Looking Forward into this Week:


Bears see hope for more red and a dive to the Kijun Sen.
Bulls maintain Higher High - Higher Low.

Senkou Span A&B way apart.

Wrap:

Hopeful Bears look to the Evening Doji Star, for life below the Tenkan Sen (Center).
Bulls look to keep above the Tenkan Sen and maintain higher lows.


SGX Nifty (Asia Singapore) - Ichimoku Weekly Study - Tenkan Sen Respite - Week 4 of April 2017.


Zoom into chart .. Click 


Introduction / Primer to Ichimoku can be read at this link (
click).


Learning from the Earlier Study: (click here for the previous post)

Previous week's Shooting Star, gives the Bears, another decent red candle.

Chikou Span (white) points down towards the price line (see extreme left). 
The Tenkan Sen (blue) was the Support.

Wrap:
Bulls dip to support at the Tenkan Sen, below the previous 'All Time High' - after the 'Shooting Star' candle. 


Looking Forward into this Week:


Bulls hope that the support at the Tenkan Sen, would save them the Blushes.
Chikou Span, preferably, needs to point away from the Price line, to keep the Bull move, going.
Bear wish list, sees life below the March 2015 High, and a crash to sub 7070 levels.


Wrap: 
Bulls riding the Bullish 'Tenkan Sen- Kijun Sen Cross', seek support at the Tenkan Sen.

Bears plan, to get the index below the Tenkan Sen and dive to the Kijun Sen. 


Brent Crude Oil - Ichimoku Weekly Study - Deliberation Dive - Week 4 of April 2017.


Zoom into chart .. Click


Introduction / Primer to Ichimoku can be read at this link (click).


Learning from the Earlier Study: (click here for the previous post)


Bears fail to negotiate the resistance zone, Index falls below the Tenkan Sen..
Index below the 61.8% Fibonacci retrace of the last major High & Low.
Chikou Span (white) touches the price line (see extreme left).

Wrap:   

Index below the Tenkan Sen after it fails to clear resistance zone - last 4 candles indicate 'Deliberation' and Fall. 


Looking Forward into this Week:


Bears would want to keep Index below the Tenkan Sen(blue) and get the Chikou Span below the Price line.
Bulls,  now just above the Kijun Sen - hope to take off, to above the Tenkan Sen.
With a Higher Low @ Kijun Sen, Bulls look to manage a Higher High above the recent resistance zone.

Wrap: 

Deliberating Bulls fail to make a clear breakout from resistance zone.
Bears wish to crack the Kijun sen and send the index back towards the Kumo.


Monday, April 17, 2017

S&P 500 (Americas, USA) - 'Weekly Technical Analysis' - Fall to Support - Week 3 of April 2017.


Zoom into chart .. Click 


Learning from last Week:  (click here for the previous post)

Index falls to Support at the 1.62 extension as marked above.
Following a Piercing Pattern the Index has fallen to a major Support Line once again.

Wrap: 

The Index pulls back to the 1.62 extension of the last major High-Low and Bears fail to crack the support.


Looking forward into this Week:

Bears hope to crack  below this Support at the 1.62 extension.
Bulls seek Higher Highs, with help from the Piercing  Pattern and off current support.
Index Support and Resistance possibilities are marked as above. 


Wrap:
Bulls hope for Higher Highs taking off from current support at the 1.62 Fibonacci.
Bears plan to sustain the downward momentum, seek to change the trend


CAC 40 (Europe Paris) - Ichimoku Weekly Study - Dragon Fly Effect - Week 3 of April 2017.


Zoom into chart .. Click 


Introduction / Primer to Ichimoku can be read at this link (click).


Learning from the Earlier Study: (click here for the previous post)

Index goes red after the Dragon Fly Doji Candle - which now looks like an an Evening Star.

Index is at a Higher High and above all indicators.
Chikou Span (White) dips towards Price line (extreme left).

Wrap:
Index dips from highs after the Doji - now the pattern resembles an Evening Star.


Looking Forward into this Week:


Bears see hope for some red and a retest of Supports.
Bulls maintain Higher High - Higher Low.

Senkou Span A&B maintain their distance.

Wrap:


Bulls look to bounce off the Tenkan Sen and maintain higher lows.
Hopeful Bears look to the Evening Doji Star, for life below the Tenkan Sen (Center).


SGX Nifty (Asia Singapore) - Ichimoku Weekly Study - Shooting star effect - Week 3 of April 2017.


Zoom into chart .. Click 


Introduction / Primer to Ichimoku can be read at this link (
click).


Learning from the Earlier Study: (click here for the previous post)

Previous week's Shooting Star, gives the Bears, a decent red candle.

Chikou Span (white) points down towards the price line (see extreme left). 
The Tenkan Sen (blue) is the near Support.

Wrap:
Bulls dip below the previous 'All Time High' - after the 'Shooting Star' candle. 


Looking Forward into this Week:


Bears hope to make more downside, care of, the Shooting  Star candle of the  Previous week.
Chikou Span, preferably, needs to point away from the Price line, to keep the Bull move, trending.
Bear wish list, sees life below the March 2015 High, and a crash to sub 7070 levels.


Wrap: 
Bulls riding the Bullish 'Tenkan Sen- Kijun Sen Cross', seek to trend up to another High.

Bears plan, to use the 'shooting star', to get the index below the Tenkan Sen and get more red on the screen. 


Saturday, April 15, 2017

Brent Crude Oil - Ichimoku Weekly Study - Deliberation - Week 3 of April 2017.


Zoom into chart .. Click


Introduction / Primer to Ichimoku can be read at this link (click).


Learning from the Earlier Study: (click here for the previous post)


Brent is now negotiating a resistance zone,  after taking off from the Kijun Sen (red) earlier cleared the Resistance at the Tenkan Sen (blue) last week.
Index between the 61.8% and 78.6% Fibonacci retrace of the last major High & Low.
Chikou Span (white) stays deflected above the price line (see extreme left).

Wrap:   

Index above the Tenkan Sen and into a resistance zone - last three candles indicate 'Deliberation'. 


Looking Forward into this Week:


Bulls would want to keep Index above the Tenkan Sen(blue) and float the Chikou Span above the Price line.
Bears make the Index stop at the old resistance cluster, and now want to head it back to the Kumo (cloud).
With a Higher Low @ Kijun Sen, Bulls look to ensure a Higher High above the oncoming resistance formed by the 'old cluster' of candles.

Wrap: 

Deliberating Bulls seek a Higher High and a clear breakout from this zone.
Bears wish to defend this resistance zone and send the index back towards the Kumo.


Monday, April 10, 2017

S&P 500 (Americas, USA) - 'Weekly Technical Analysis' - Resisted Again - Week 2 of April 2017.


Zoom into chart .. Click 


Learning from last Week:  (click here for the previous post)

Index again flirts with to the 2.62 extension with a Red 'High Wave' candle as marked above.
Last three candles on the Weekly chart above, show a Piercing Pattern and its follow up a High Wave candle.

Wrap: 

The Index throws back to the 2.62 extension of the last minor High-Low and Bulls fail to clear the resistance.


Looking forward into this Week:

Bears hope to again close the week below this old resistance (2.62).

Bulls seek Higher Highs and a close above resistance (2.62) with help from the Piercing  Pattern.
Index Support and Resistance possibilities are marked as above. 


Wrap:
Bulls hope for Higher Highs based on the Piercing Pattern.
Bears having stopped the index thrice at the 2.62 resistance, seek to keep the pressure on, and hope to change the trend


CAC 40 (Europe Paris) - Ichimoku Weekly Study - Dragon Fly High - Week 2 of April 2017.


Zoom into chart .. Click 


Introduction / Primer to Ichimoku can be read at this link (click).


Learning from the Earlier Study: (click here for the previous post)

Index consolidates last week - Dragon Fly Doji Candle.

Index is at a Higher High and above all indicators.
Chikou Span (White) steady at High (extreme left).

Wrap:
Index holds on to its Highs.


Looking Forward into this Week:


Bears see hope for some red and a retest of Supports.
Bulls maintain Higher High - Higher Low in style.

Senkou Span A&B maintain their distance.

Wrap:


Bulls look to get to the next resistance and maintain higher lows.
Hopeful Bears look to the Dragon Fly Doji, for life below the Tenkan Sen (Center).


SGX Nifty (Asia Singapore) - Ichimoku Weekly Study - Shooting a Higher High - Week 2 of April 2017.


Zoom into chart .. Click 


Introduction / Primer to Ichimoku can be read at this link (
click).


Learning from the Earlier Study: (click here for the previous post)

Bulls keep above support and take the Index Higher - weekly candle resembles a Shooting Star.

Chikou Span (white) flat, but towers above the price line (see extreme left). 
The Tenkan Sen (blue) is fall back Support.

Wrap:
Bulls continue above the previous 'All Time High' - Bears make the Weekly candle a 'Shooting Star'.


Looking Forward into this Week:


Bulls continue to reap rewards from the Tenkan Sen and Kijun Sen cross - which has been a strong Bullish Influence.
Chikou Span - needs to stay above the Price line to keep the Bull move alive.
Bear wish list sees life below the March 2015 High, and a crash to sub 7070 levels.


Wrap: 
Bulls riding the Bullish 'Tenkan Sen- Kijun Sen Cross', seek the stars with another High.

Bears plan to shoot the index towards the Tenkan Sen and get some red on the Index. 


Saturday, April 8, 2017

Brent Crude Oil - Ichimoku Weekly Study - Back in Range - Week 2 of April 2017.


Zoom into chart .. Click


Introduction / Primer to Ichimoku can be read at this link (click).


Learning from the Earlier Study: (click here for the previous post)


Brent after taking off from the Kijun Sen (red) earlier cleared the Resistance at the Tenkan Sen (blue) last week, and is now in the old range / cluster.
Index between the 61.8% and 78.6% Fibonacci retrace of the last major High & Low.
Chikou Span (white) stays deflected above the price line (see extreme left).

Wrap:   

Chikou Span spikes off the Price line, Trending Index clears the Tenkan Sen. 


Looking Forward into this Week:


Bulls would want to keep Index above the Tenkan Sen(blue) and prevent the Chikou Span from going  below the Price line.
Bears want to see Index stop at the old resistance cluster and head back to the Kumo (cloud).
With a Higher Low @ Kijun Sen, Bulls look to ensure a Higher High above the oncoming resistance formed by the 'old cluster' of candles.

Wrap: 

Buoyant  Bulls seek a Higher High and life above the 61.8% Fibonacci retrace. 
Bears wish to defend this resistance zone and send the index towards the Kumo.


Monday, April 3, 2017

S&P 500 (Americas, USA) - 'Weekly Technical Analysis' - Pierced - Week 1 of April 2017.


Zoom into chart .. Click 


Learning from last Week:  (click here for the previous post)

Index does a throw back to the 2.62 extension from the 1.62 Fibonacci resistance as marked above.
Last two candles on the Weekly chart above, show a Piercing Pattern.

Wrap: 

The Index throws back to the 2.62 extension of the last minor High-Low and Bulls consider the Piercing Pattern studied.


Looking forward into this Week:

Bears hope to close the week below this old resistance (2.62).

Bulls seek Higher Highs and a close above resistance (2.62) with help from the Piercing  Pattern.
Index Support and Resistance possibilities are marked as above. 


Wrap:
Bulls comeback from Support and consider Higher Highs based on the Piercing Pattern.
Bears having stopped the index twice at the 2.62 resistance, seek to keep the pressure on, and hope to change the trend